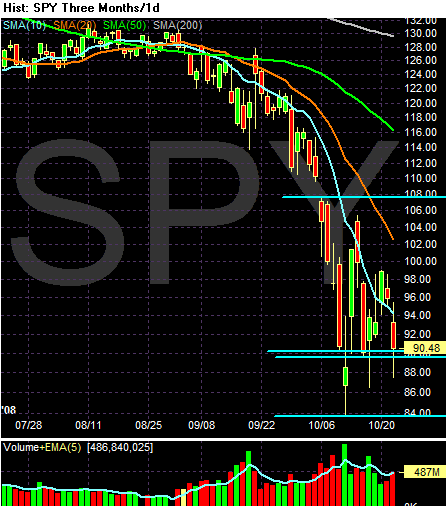
Despite the large move today (SPYs down 5.61%), we're still within my range which is roughly 90-108. However, the overall tenor of the chart is still negative -- all the SMAs are moving lower, the shorter SMAs are below the longer SMAs and prices are still below all the SMAs.

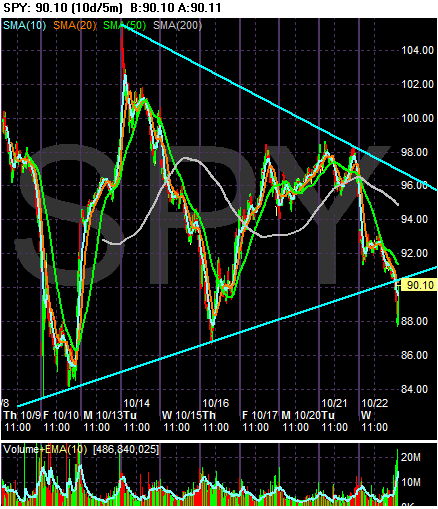
Both Trader Mike and Afraid to Trade are looking at the SPYs as a triangle consolidation pattern. I don't disagree with this read. The chart above demonstrates a triangle is very clear.

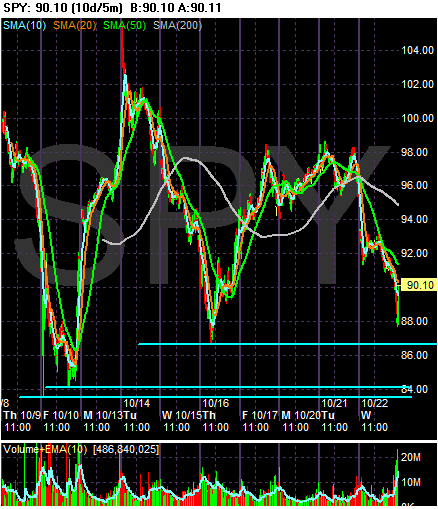
However, given the high volatility of the market right now along with the wide-open nature of the economy and overall situation, I'm more comfortable looking at this solely from a trading range pattern. I'm also more concerned with the chart's lows. I still think 90 is the most important low -- if we move through that level I don't think the lower points near 84 are nearly as strong. That means the market really needs to hold at the 90 level.