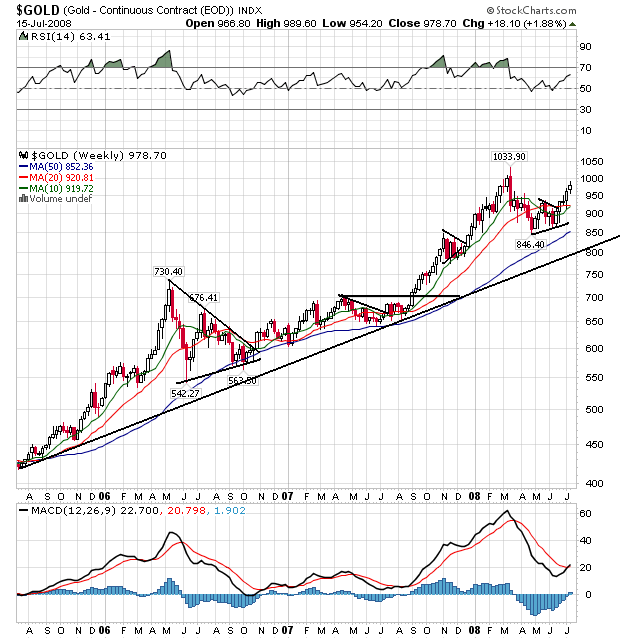
The three year weekly gold chart is in a clear bull market. It has continually moved higher, consolidated gains and then moved higher. This is a good example of what an extended rally should look like.
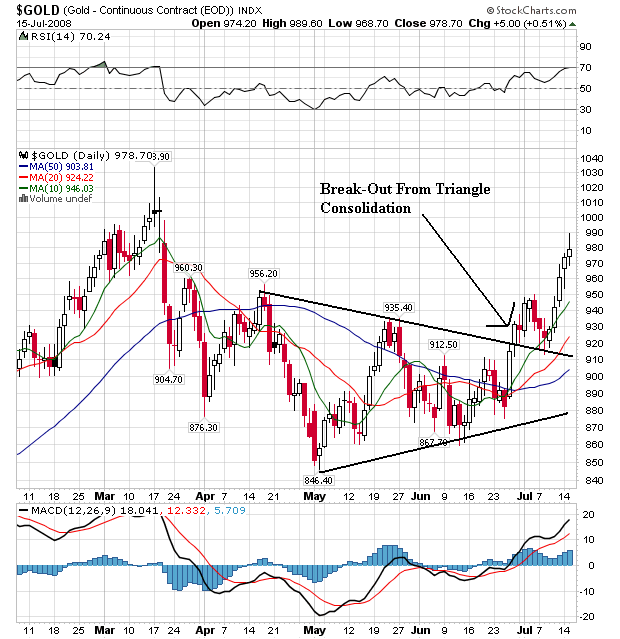
On the daily chart, notice the following:
-- Gold consolidated in a triangle from mid-April to late June of this year
-- Prices have broken through upside resistance from the triangle
-- The shorter SMAs are now above the longer SMAs
-- All the SMAs are moving higher
-- Prices are above all the SMAs
This chart is short-term very bullish.
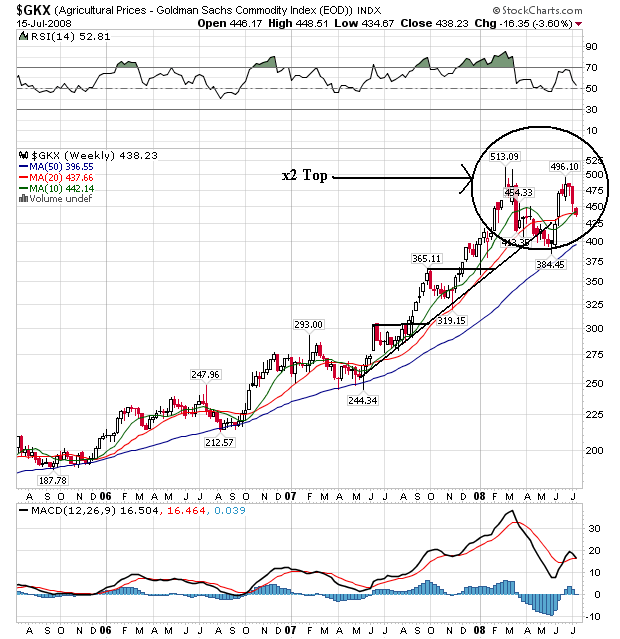
On the weekly agricultural prices chart, notice that prices are forming a double top. This is to be expected for several reasons. First, nothing cures high prices like high prices. In other words, as prices increase they lead to a change in the nature of supply and demand -- either people will demand less (unlikely with food) or more supply will come on the market. Either way prices start to drop.
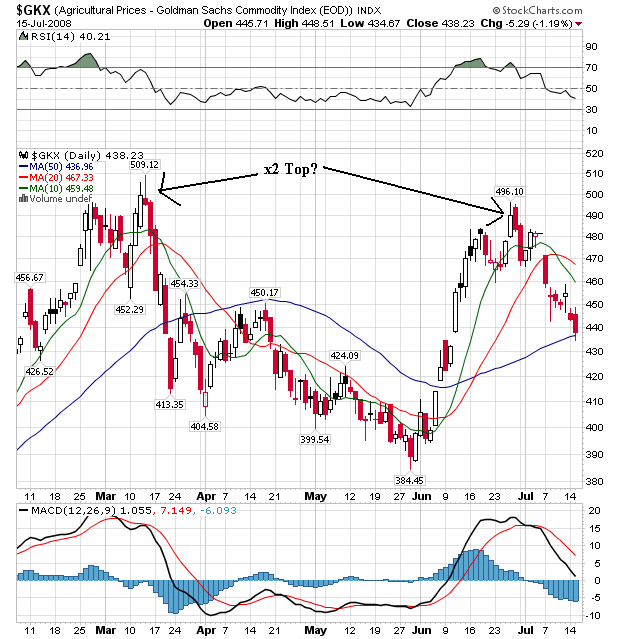
On the daily chart the double top is clearer. Also notice the following:
-- Prices have moved bellow the 10 and 20 day SMA.
-- The 10 and 20 day SMA have both turned lower
-- The 10 day SMA has crossed below the 20 day SMA
-- Prices are currently using the 50 day SMA as technical support
The recent run-up is a direct result of the Iowa floods. As the flood waters receded, the reason for bidding up prices disappeared. Also note that before the Iowa floods prices were already dropping, indicating a change in the market's psychology. This chart is shifting from a bullish to a bearish chart, but hasn't quite made the transition complete yet.
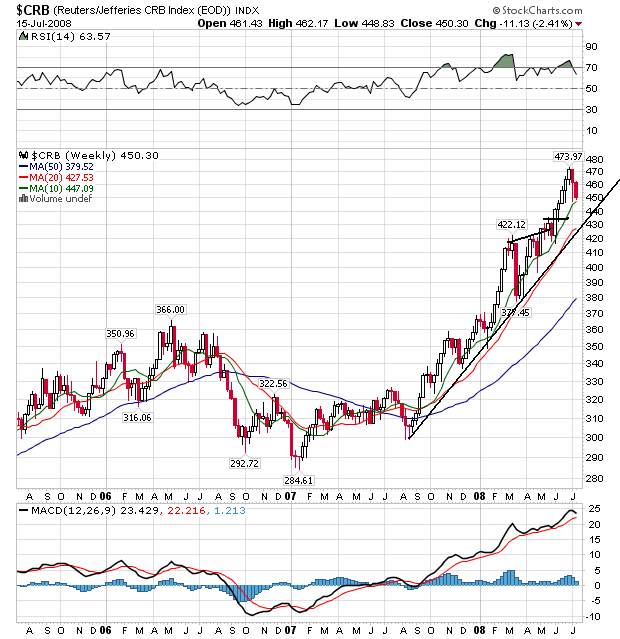
Overall, the CRB is still in the middle of a strong bull run that started in mid-2007. Prices have continually moved through upside resistance, consolidated gains, and then moved higher.
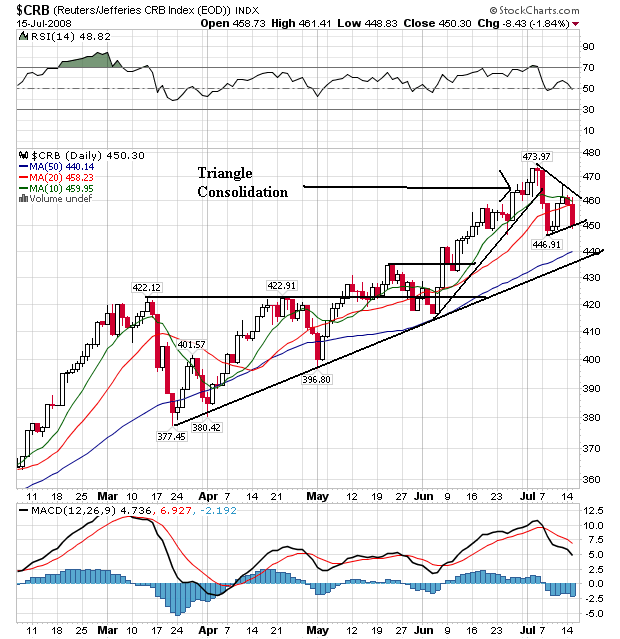
On the daily chart, notice the following:
-- Prices have been rising since late March, although the 420-430 area provided a great deal of upside resistance
-- Prices broke a mini-rally that started in June
-- Prices have now dropped a bit and are consolidating in a triangle pattern
-- Notice that prices and the 10 and 20 day SMA are bunched together. This is still bullish, but a bit less so then the other charts we have seen.
-- Also note the 10 day SMA is now headed lower, although it is still above the 20 day SMA
-- Prices have moved below the 10 and 20 day SMA
-- Note that in the past, prices have used the 50 day SMA area as support. They may be looking to do that again.
Overall, this is still a bullish chart, but less so then others we have seen. There are some incredibly strong bullish trends, but it looks as though we're going to see a bit of a consolidation or correction in the near future.
So, we have gold telling us inflation expectations are increasing. With oil in a rally that shouldn't be surprising. However, agricultural prices are dropping which is putting some downward pressure on the CRB.