Lots of interesting action in the oil market over the last few days. The primary reason is the news contained in the weekly oil market report along with a sluggish economy:
Futures have dropped $10.58, or 7.3%, over the last two sessions on concerns that a prolonged economic downturn in the U.S. will leave a hole in oil demand too big for growing Asian economies to fill. Oil prices remain up about 80% from a year ago, however, and the market has recovered from proportionately larger downward corrections this year.
Stockpiles of crude oil and gasoline as reported by the U.S. Energy Information Administration rose unexpectedly in the week ended July 11. Distillates, a category of fuel that includes diesel and heating oil, increased by twice as much as expected.
Oftentimes rising inventories signal faltering demand.
"This is about as straightforward a set of bearish data as we're likely to see," said Tim Evans, an analyst with Citi Futures Perspectives.
Sluggish growth and record oil prices have translated into a 2% drop in U.S. gasoline demand this summer. Gasoline futures have tended to lag behind crude, while heating-oil futures, acting as a stand-in for world-wide diesel demand, have seen bigger gains. Refiners responded by turning a record 30% of their production over to distillates last week. Growing inventories are the result.
I should add: this is one week's report. While the news is bearish, it is still one week's report, in a series of trends. Another way to look at this situation is the market needed a reason to take profits and this week's news gave the market the reason to do so. If we see a few more weeks news like this, then we can say things may be changing. But right now we have a single data point which is counter to a whole series of data points.
Let's go to the charts to see what all of this means.
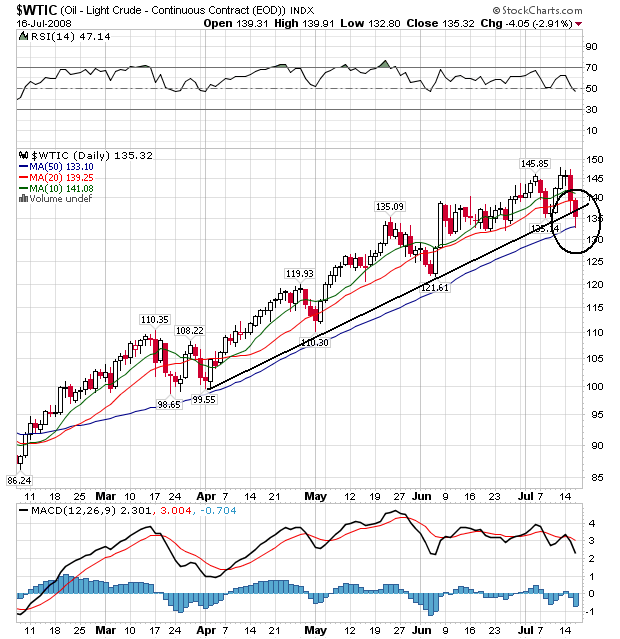
Yesterday prices broke the upward sloping trendline that started in early April. Now there are two important points to make:
-- The amount of the break is small. In his book on technical analysis, Pring uses a 2%-3% rule, meaning prices have to break a trend by a specific amount. This allows for daily fluctuations and in general is a good rule.
-- Will the trend break continue? If we continue to see prices move lower or sideways, then we can say we've got a definite change in psychology.
In addition, note the following:
-- The 10 day SMA has just turned downward
-- The 20 and 50 day SMAs are still moving higher
-- The shorter SMAs are still above the long term SMAs
-- Over the course of this rally, note that prices have corrected between the 20 and 50 day SMA.
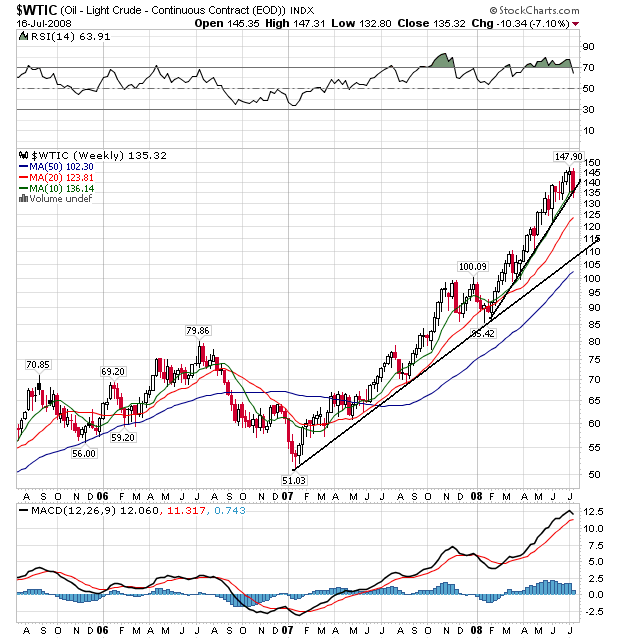
On the weekly chart, notice that prices are also on the verge of breaking through support. However -- this is a weekly chart, and the week isn't over yet. That means the bar could change over the next few days.
Also note the following:
-- The shorter SMAs are above the longer SMAs
-- All the SMAs are moving higher
-- Prices are right at the 10 week SMA
In other words, there are still a lot of technically bullish signs on this chart
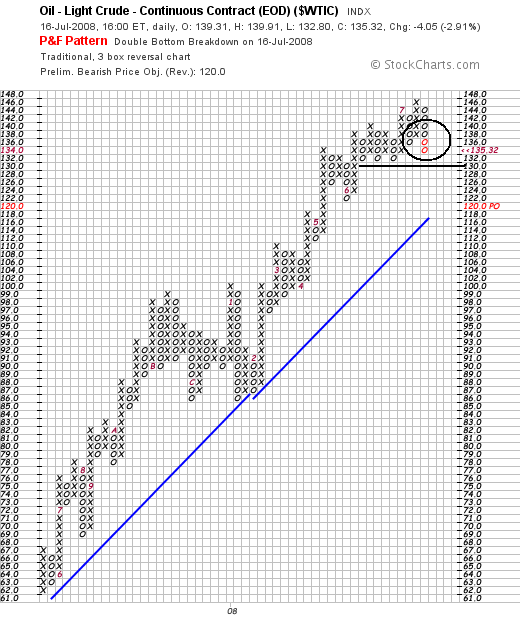
On the PF chart, notice the following:
-- The chart added two more o's yesterday, meaning prices are moving lower.
-- BUT -- note there is strong price support at 132.
To sum up, we have two days of a sell-off caused by a single report. We have a long way to go before we're in correction territory. But we mush also be aware that new information which runs counter to the prevailing sentiment and perception is out there as well.