Zions Bancorporation, National City Corp. and First Horizon National Corp. tumbled as Goldman Sachs Group Inc. said regional banks may cut their dividends to restore capital. M&T Bank Corp. slumped the most since 1987 after mortgage losses hurt second- quarter profit. Apple Inc. climbed after selling twice as many of its new iPhones as some analysts had estimated.
.....
``The factors that affected IndyMac are not isolated -- while they're probably more severe, the pressures are evident in other financials,'' said Alan Gayle, the Richmond, Virginia-based senior investment strategist at Ridgeworth Capital Management, which oversees about $74 billion. The Treasury's plan for Fannie Mae and Freddie Mac is ``encouraging, but it does suggest that credit availability is going to remain somewhat impaired and borrowing costs will likely be higher.''
Below is a chart of teh bigger financial institutions as represented by the XLF. Here are two charts of the regional bankshares ETF:
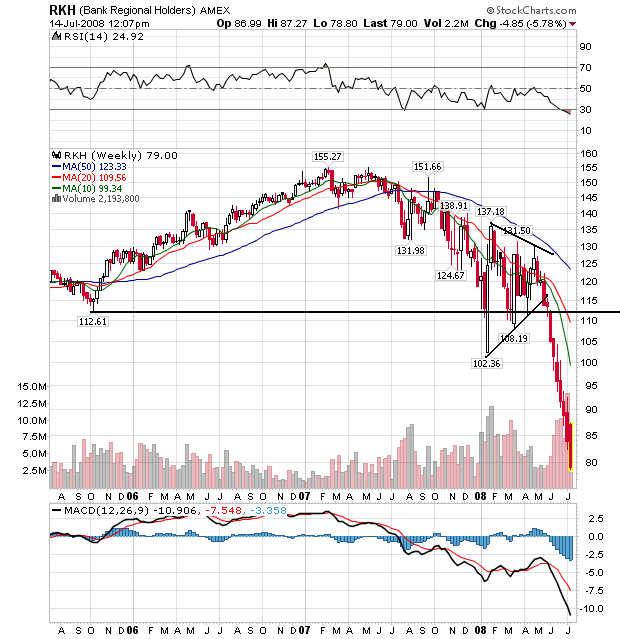
On the weekly chart, notice that prices have been dropping since the beginning of 2007. Part of that is a natural sell-off that occurred after a strong rally. Notice that prices dropped slightly but but precipitously. Starting at the end of last year is when we see the bigger drops in the market.
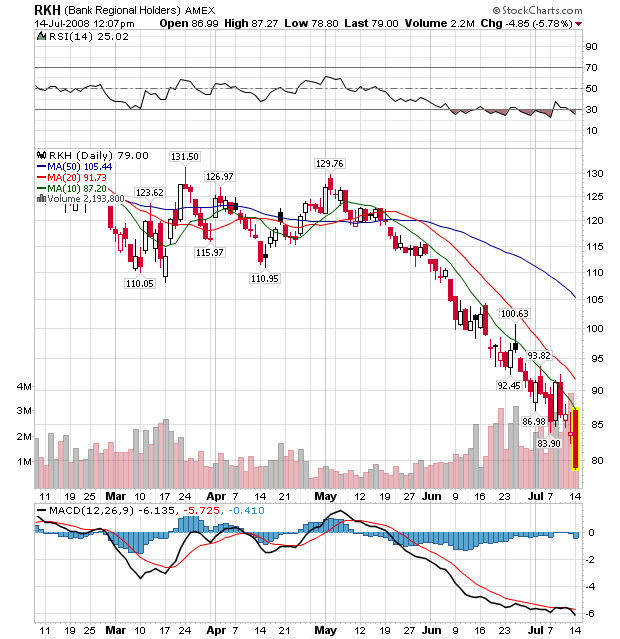
On the daily chart, notice that prices have been dropping hard since the beginning of May. Also notice the following:
-- Prices are below all the SMAs
-- The SMAs are all moving lower
-- The shorter SMAs are below the longer SMAs
This is a bearish chart, plain and simple