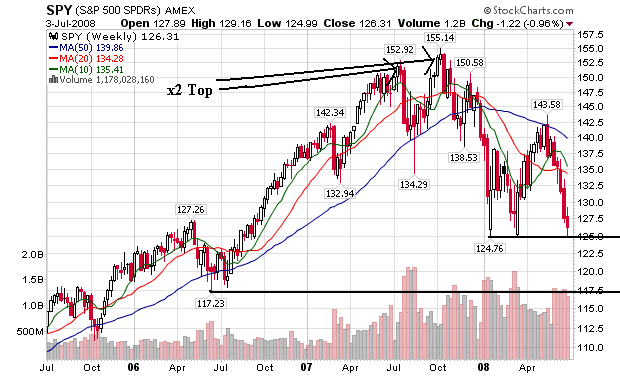
On the weekly view, notice the following:
-- The SPYs formed a double top in mid-2007. Since then they have dropped
-- Prices are below the 200 week SMA
-- Prices are below all the SMAs
-- All the SMAs are heading lower
-- If price move through 124 in a convincing way, the next support level is at 117
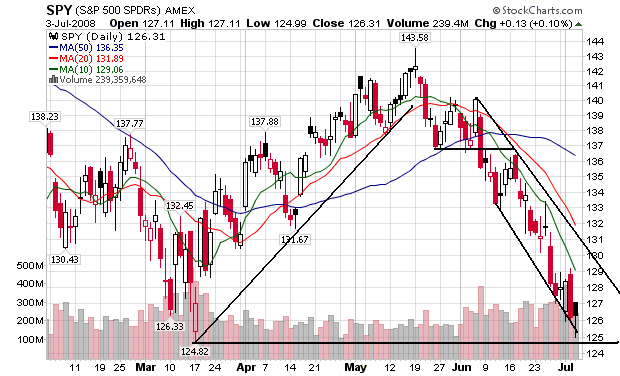
On the daily chart, notice the following:
-- Prices are below all the SMAs
-- All the SMAs are headed lower
-- The shorter SMAs are below the longer SMAs
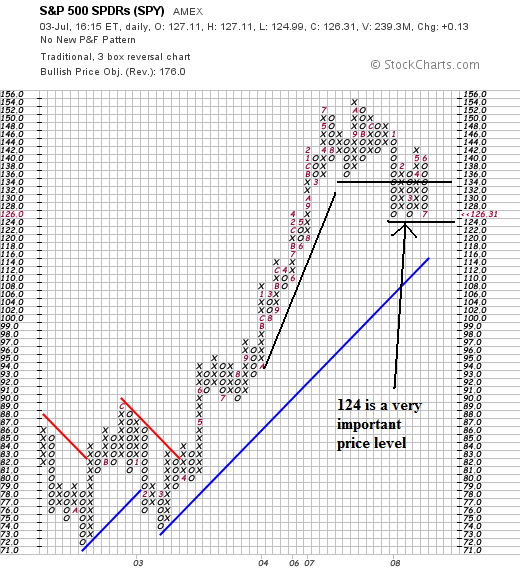
The P and F chart shows the precariousness of the current price situation. Notice the importance of 124 as a support level.