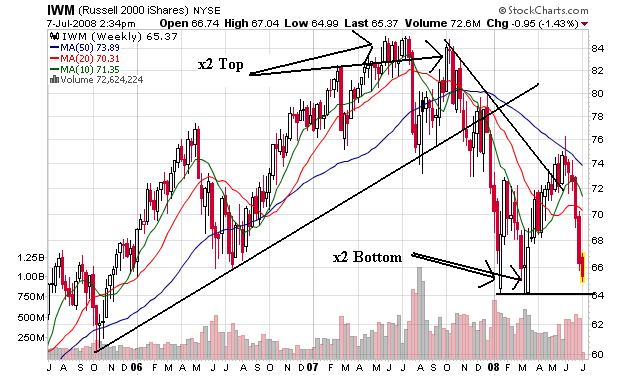
On the weekly chart, notice the index was in a rally from the end of 2005 to end of 2007, when the index fell from a double top formation. The index then dropped and formed a double bottom in early 2008. The index rallied -- like all other rallies -- when the Fed backstopped the Bear Stearns deal. But now the momentum has run out and the index is falling.

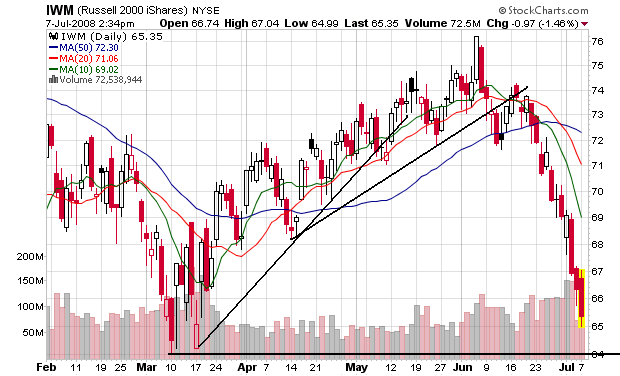
On the daily chart, notice the following:
-- Prices have been dropping for the last few weeks
-- Prices are below all the SMAs
-- All the SMAs are moving lower
-- The shorter SMAs are below the longer SMAs
This is a very bearish chart

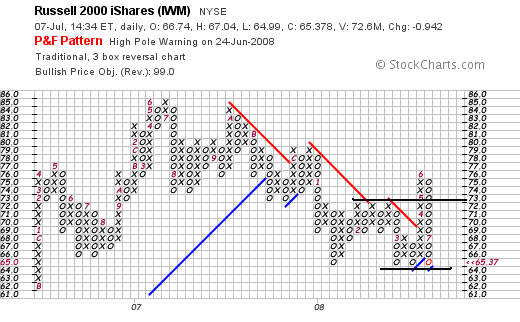
On the P&F chart, notice prices are at a crucial support level.