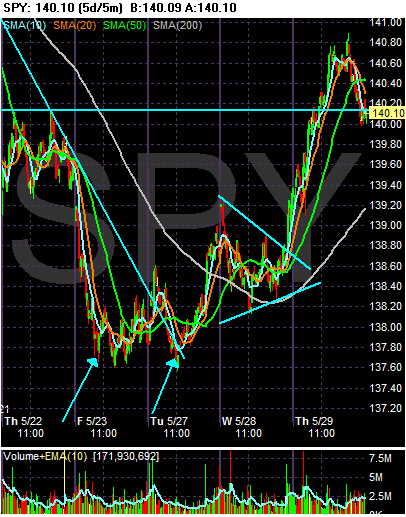
On the SPYs, notice the double bottom that formed on Friday and Tuesday. The market rose a touch from this formation, consolidated in a triangle pattern on Wednesday and then rallied hard today on the GDP and oil news. Also note the SPYs ended the session right at technical support levels.

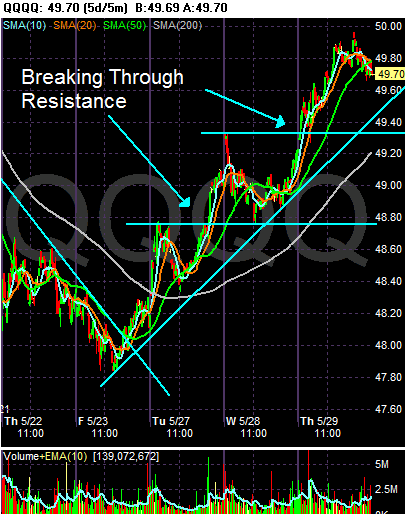
On the QQQQs, notice there is a much better chart in play. The market has been rising and then consolidating gains since Friday of last week.

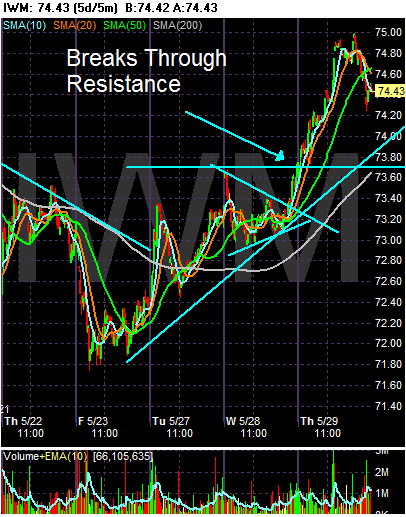
The IWMs are more in the line of the SPYs, largely because of their triangle consolidation a few days ago.