I'm going to look at the charts a bit backwards today. First, remember the QQQQs have been the market leader for the this rally.
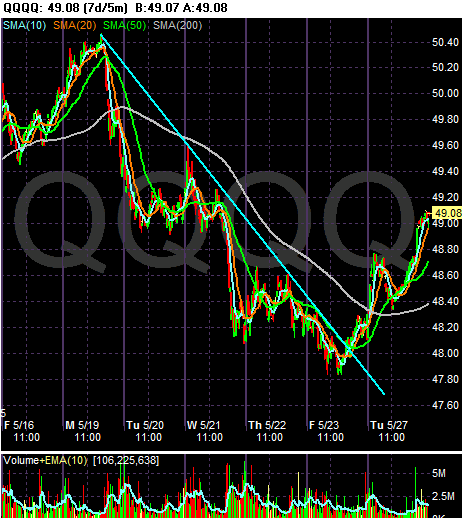
That's why today's action is so important. The QQQQs showed some life. Note they closed near their session highs.
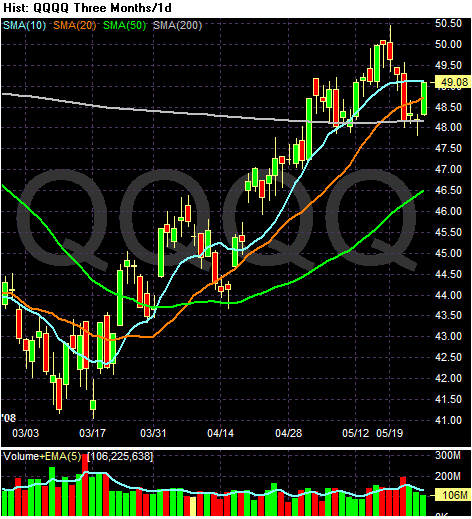
On the daily chart, notice the index bounced off the 200 day SMA -- a very important technical development. Also note that prices are right at the 10 day SMA. If they move through that level we could see a further rally.
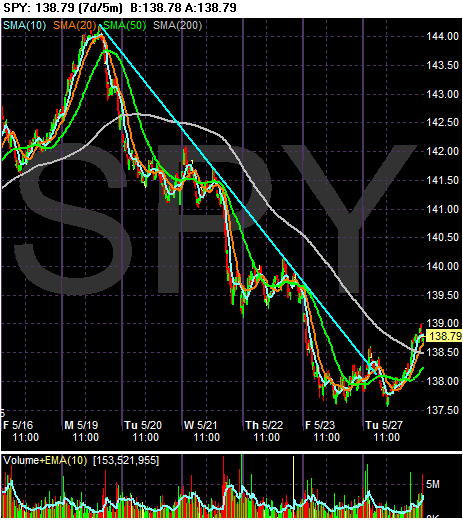
The SPYs followed suit. Notice the possible double bottom with the first bottom on Friday and the second bottom today.
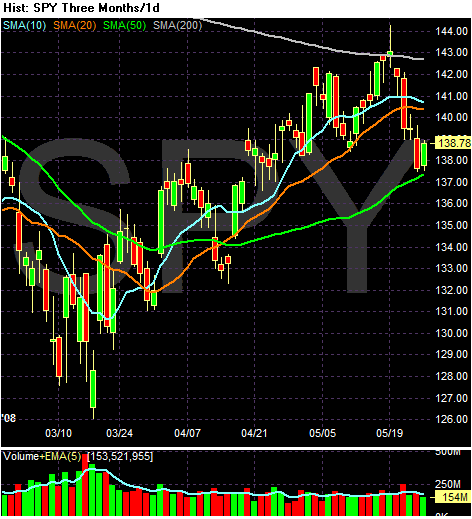
On the daily chart, notice the SPYs are consolidating right above the 50 day SMA. But also note the 10 day SMA is starting to move a bit lower.
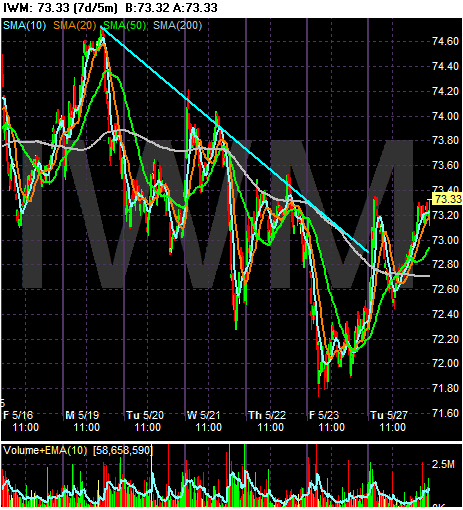
The IWMs also gained today.
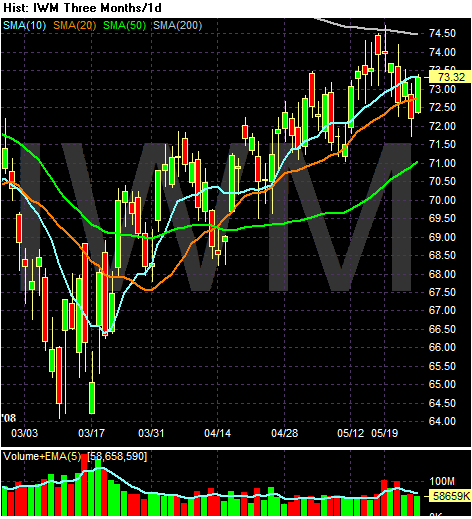
And notice they moved through the 20 day SMA are are trading right at the 10 day SMA.