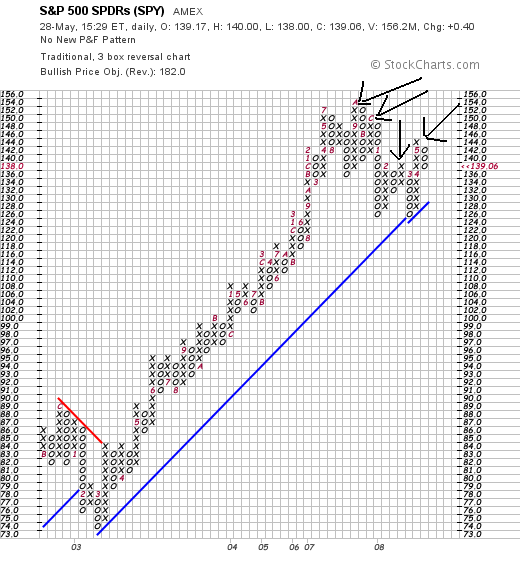
On the SPYs notice there are two possible interpretations. First, we have a series of lower highs -- which could indicate we're heading lower. However, there is an intermittent high -- the third peak -- that could be the beginning of another round of increasing highs. Also note that prices broke the trend line started in 2003, which lends credence to the argument that we're moving lower.

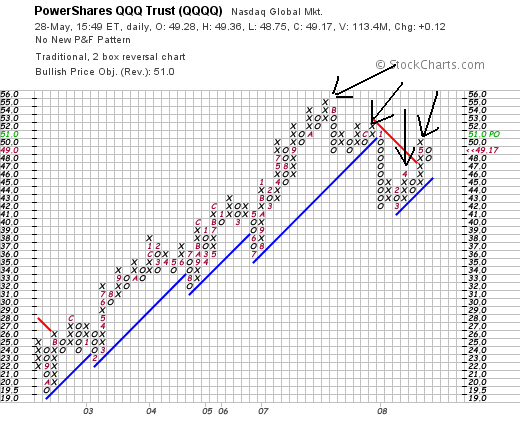
On the QQQQs note we have the same technical issues as with the SPYs -- that it's possible we're entering a new rally or are in a period of lower highs. However, also notice the big sell-off that started at the beginning of 2008 and the fact that that sell-off broke a trend line. That should tell you we're in a downward move overall right now.

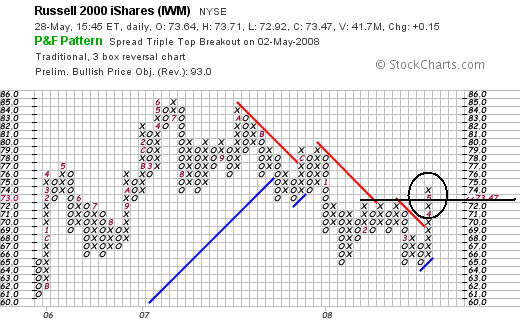
What's interesting with the IWMs is that while they were falling since mid-2007 they have clearly broken higher in the latest rally. Also note they had a hard time breaking the 72 level, but eventually got there.