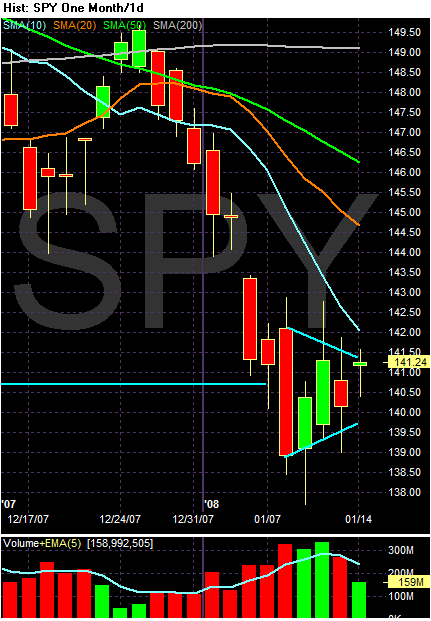
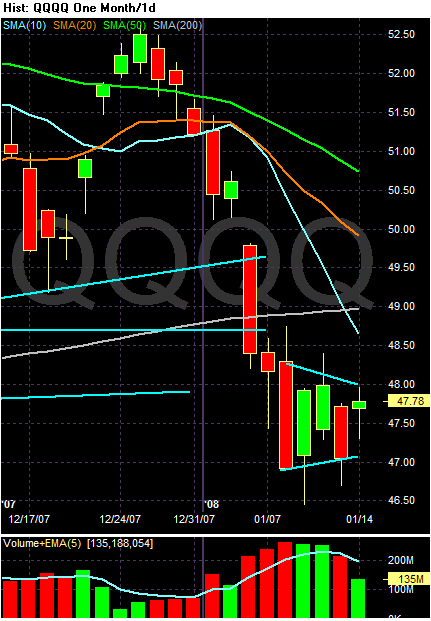
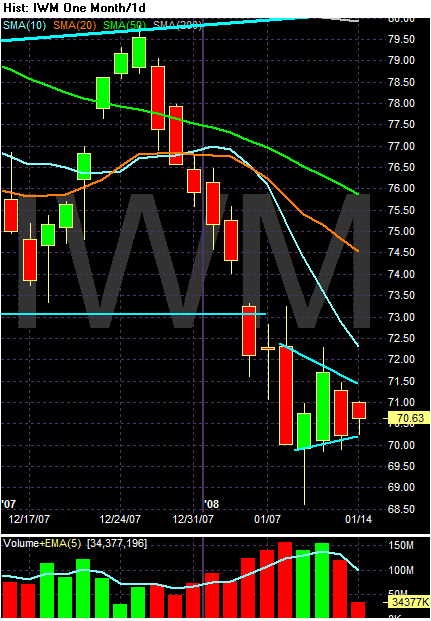
Now -- on to where we are in the big picture. I think the market is already in a correction. Here are the daily charts that show a clear up, down, up pattern.
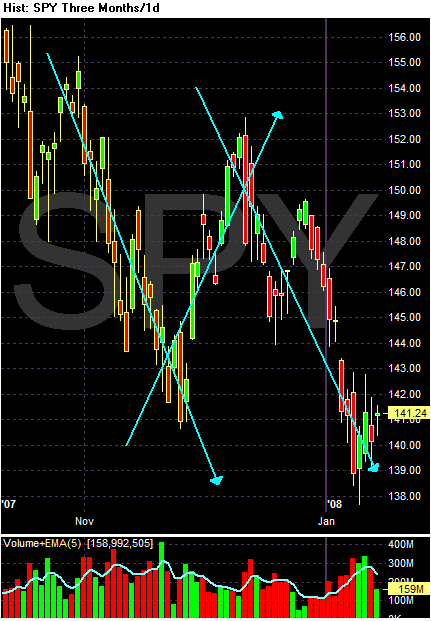
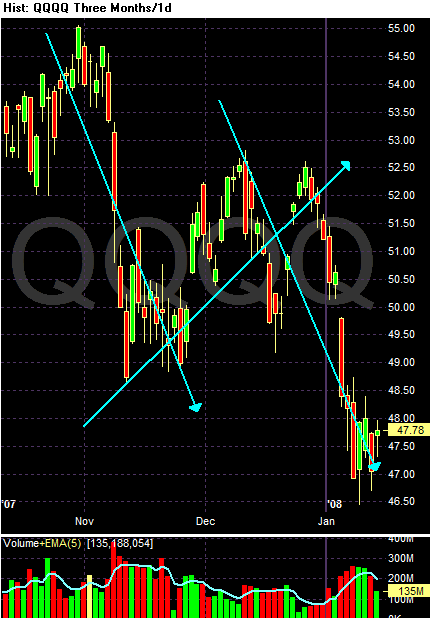
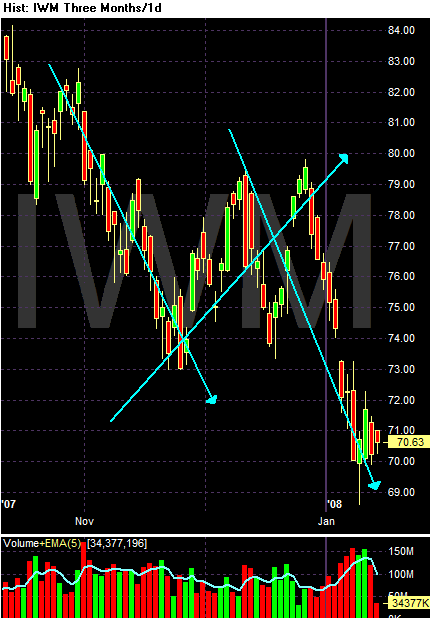
What's interesting about this theory is what the upward catalyst would be. Right now I can think of two.
1.) A weak PPI/CPI report which would imply the Fed has more maneuvering room than previously thought regarding interest rates.
2.) A stronger showing than expected from a larger number of companies regarding their 4th quarter earnings.