U.S. corporate profits are in a recession, and the entire economy may not be far behind.
Slower sales and higher energy and labor costs are forcing companies from Bear Stearns Cos. to Pitney Bowes Inc. to reduce spending and hiring. Their efforts to keep earnings from eroding even further raise the risk that the economy, already weakened by the steepest housing slide since 1991, may shrink sometime next year.
``The earnings recession has already arrived,'' says David Rosenberg, North America economist for Merrill Lynch & Co. in New York. ``We are going to see an economic recession in '08.''
Corporate profits, as measured by the Commerce Department, fell at an annual rate of $19.3 billion in the third quarter from the second, as domestic earnings dropped by $41.2 billion. The drag from sagging U.S. sales and huge writedowns offset robust earnings abroad, fueled by the weak U.S dollar. The fourth quarter may be an even bigger bust.
``In the third quarter, the tide shifted, and for the worse,'' says Joseph Quinlan, chief market strategist for Bank of America Corp. in Charlotte, North Carolina. ``The domestic-profits squeeze is in its early stage
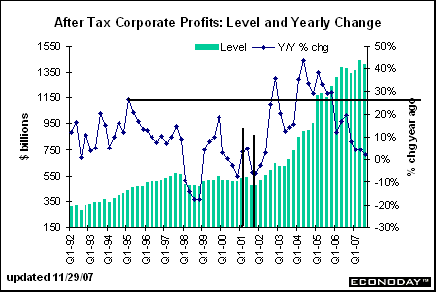
Let's look at a chart from Econoday:

There is some interesting information in this chart.
1.) Notice that in the 1990s, corporate profit growth was more consistent. From 1992-1997, year-over-year percent change came in between 10% and 20% on a steady basis. While there were no high-flying years, there also weren't any low-flying years either.
2.) The huge spike up in early 2003 is more the result of historical placement than accelerating earnings.
3.) The spikes 2004 are partially the result of placement -- that is, comparisons to particularly weak years. However, there are also some incredibly strong data points that are the result of a strong corporate earnings environment.
4.) The year-over-year numbers have been coming down since early 2005.
5.) Note the last three year-over-year comparison numbers aren't really that strong, especially compared to previous quarters. In other words, the earnings growth has been slowing for a bit.
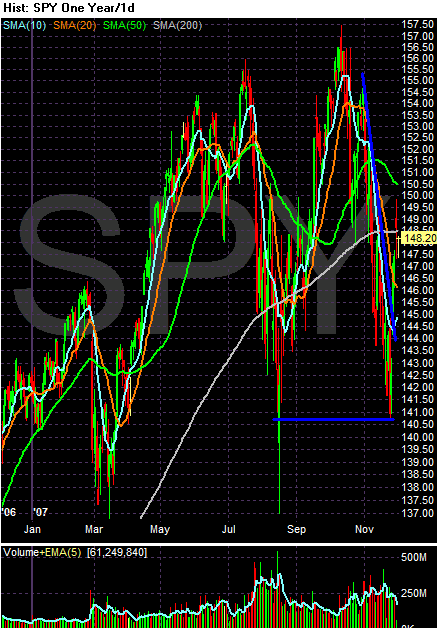
When we compare the last three quarters growth (Q107, Q207 and Q307) with the SPY chart we get some very interesting points. First, here is the SPYs chart.

Note the SPYs dropped hard at the beginning of March. This would roughly correspond to the beginning of announcements for the first quarter (Q107) earnings season.
The SPYs also dropped hard in August. Part of the is the result of the Bear Stearns announcement regarding its two now bankrupt hedge funds. But also consider that this would also correspond roughly to the middle of announcements for second quarter (2Q07) earnings season.
Also note the SPYs peaked in early October and started declining since then. This roughly corresponds to the beginning of third quarter earnings season (3Q07).
While there are other important reasons for the markets' sharp sell-offs this year, the earnings environment cannot be ignored.