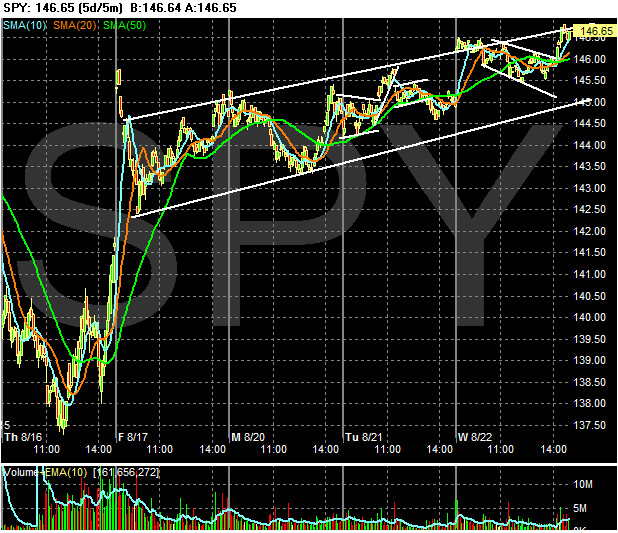
Here's the 5-day chart. Notice we have a 4-day rally in progress. We also have the average cautiously moving up. In short, this may be an indication traders are more willing to move back into the market right now.
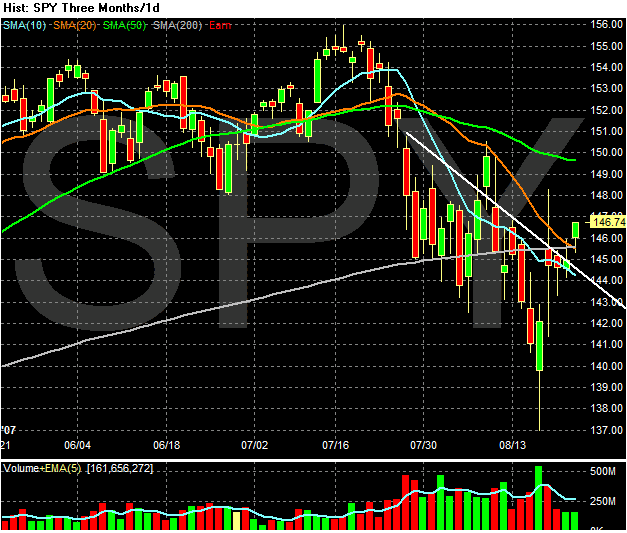
Here's the daily chart, and there is one point that creates a great deal of concern -- the decreasing volume of this mini-rally. In addition, notice the last four days candles aren't that strong; we're not seeing bold moves higher. Instead, we're seeing smaller bars. However, no rally is perfect, and these points may not mean anything. It's just as possible that the recent sell-off has naturally thinned volume in the markets for now.