Financials: 20.77%
Information Technology: 15.45%
Health Care: 11.67%
Industrials: 11.43%
Energy: 10.79%
These total 70% of the index.
Here are the 3-year charts in order of largest percentage to smallest.
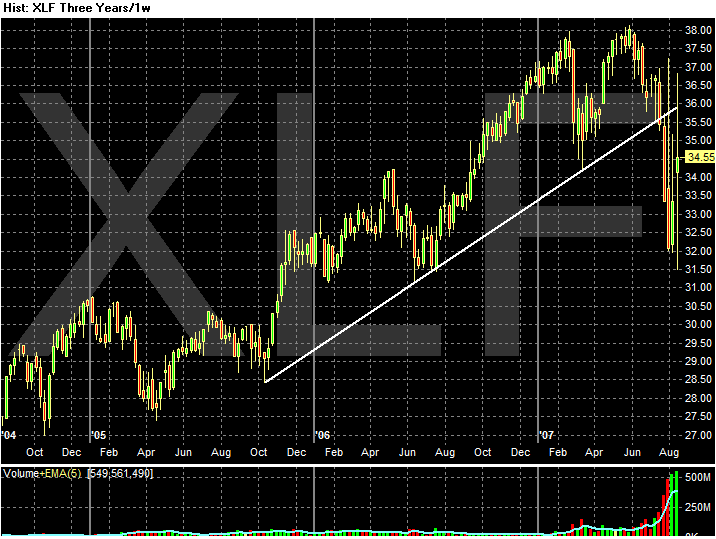
Financials
In July the financial sector broke a year and a half uptrend on heavy volume. It's possible the index formed a double top in 2007, although I would expect less volume on the second top of a "classic" double top formation. Most troubling is the breaking of the trend on high volume. This sector is not looking well
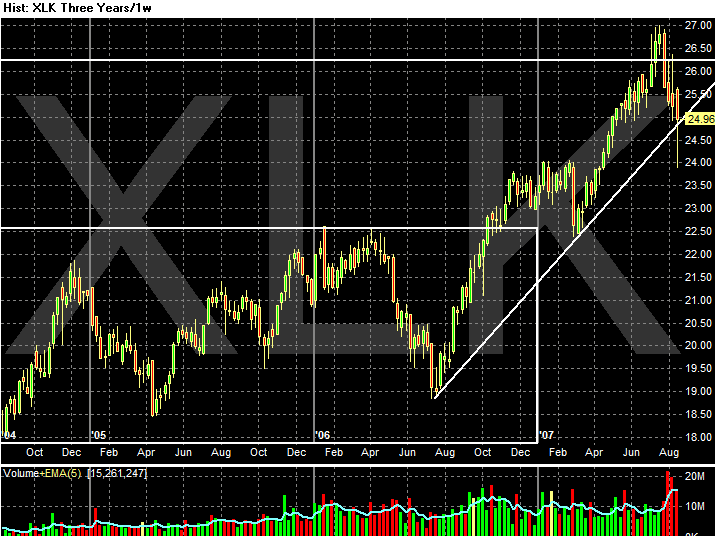
Technology
Technology is barely holding on to a year-long rally. It has sold off on high volume the last three weeks. A move below the trendline would obviously indicate selling pressure still remains among traders.
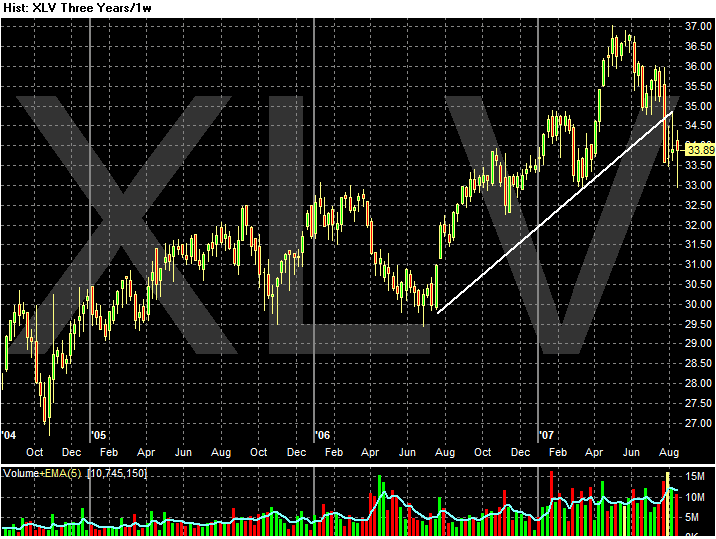
Health Care
Health Care broke a year-long trend in late July and is currently looking for a bottom.
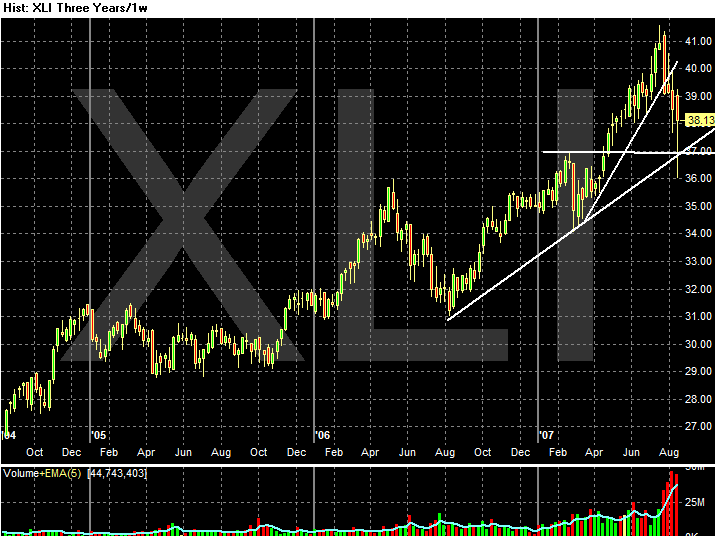
Industrials
Industrials have broken a short-term upward trend but are still above the trend-line of their year-long rally. Don't be surprised to see this sector move down to its year-long trend line and testing that level.
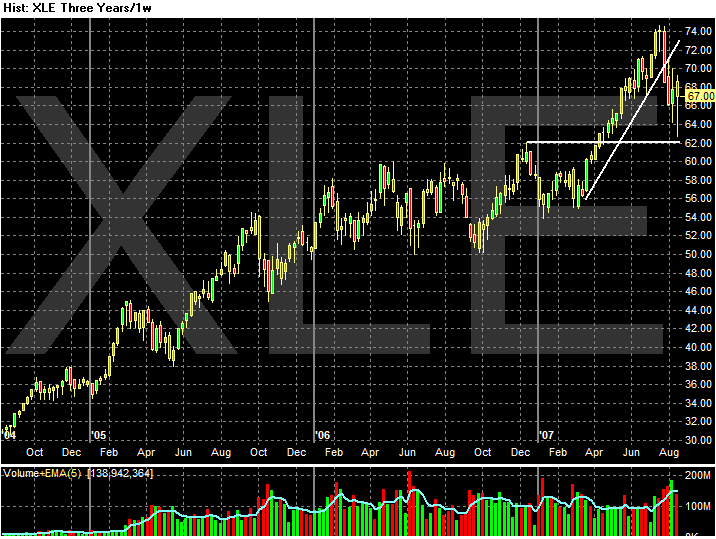
Energy
Energy broke it's upward moving trend line in a similar manner as industrials. However, this sector has a ton of support from the year long consolidation pattern in 2006.
To sum up:
Two sectors -- financials and health care -- have already broken their trend line. This is obviously bearish.
Technology is hang on. This week's action will be crucial.
Industrials and Energy are doing pretty well.