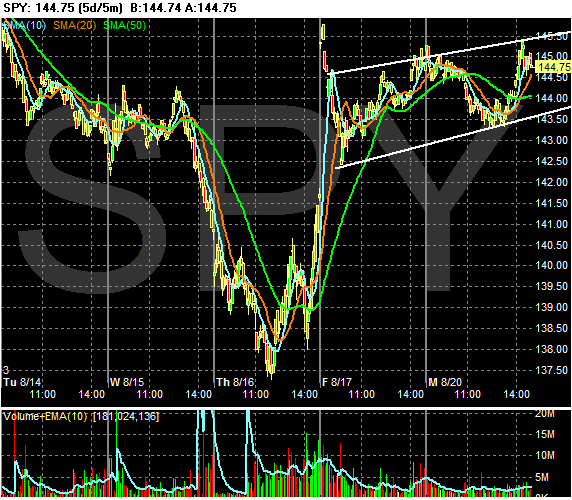
Here's the 5-day chart. Notice the market is in a slight uptrend.

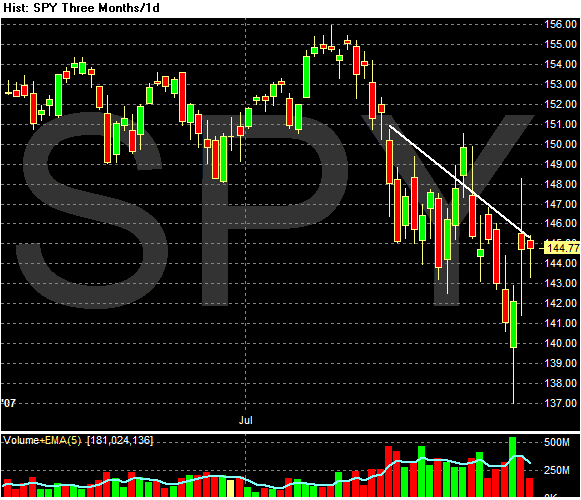
Here's the 3-month chart. Notice the SPYs are still bumping up into the upper trend line.

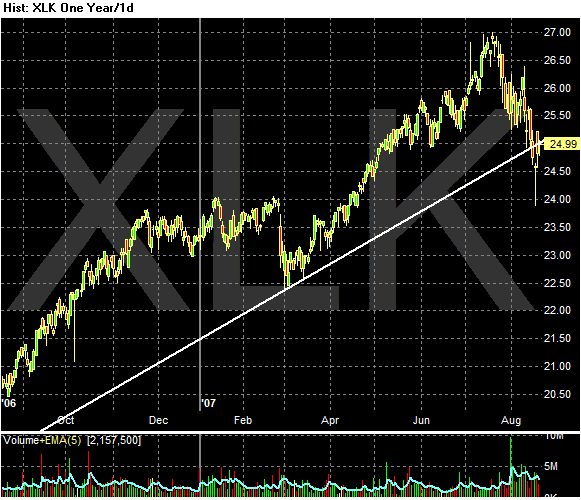
Finally, here's a chart of the XLK (technology). This is the second largest S&P 500 sector behind financials and it is barely holding onto its uptrend. This week is very important for this part of the SPYs because it could hold the key to whether or not the index advances or declines.
