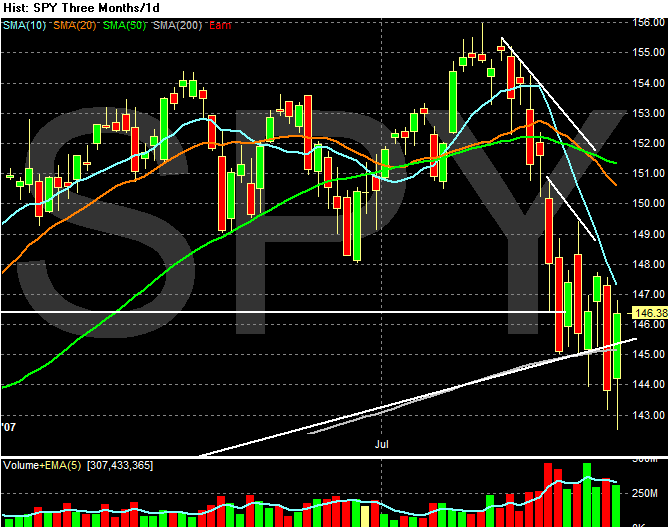
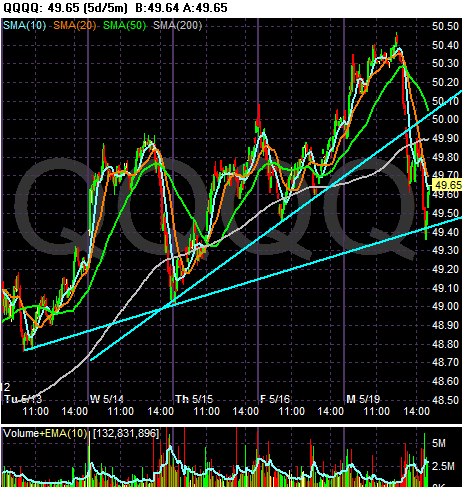
Here are the SPYs and the QQQQs. Notice each of these tracking stocks was in a price channel for about three years. Also notice both of these indexes broke out or their respective price channels. The SPYs did it in late 2006 and the QQQQs did it in the spring of 2007. These markets may simply be returning to their price channels.


The IWNs are already at the bottom of their 3 and a half year price channel. A move lower would be a very bad event.
