Here's the chart we're working with. It's a 6 month SPY chart.
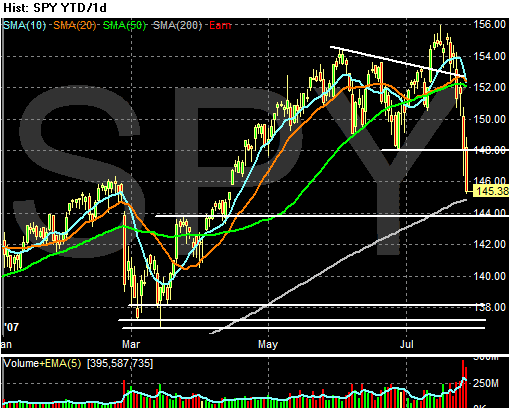
Considering last week's sell-off, let's look at the market to see where support is.
-- Let's use the 5%-10% range as a standard bull market correction.
-- The SPYs stopped out at about 155. 5% of that is 7.75 points. That means a 5% correction would be 147.25, which we went through on Thursday, and which we closed below on Friday.
-- 10% of that is 15.5, so a drop of 10% would send the market to about 139.50. Notice we have the support from the March lows about a point and a half below that number.
Let's add come complicating factors.
-- The SPY is already looking at the 200 day SMA as support. Standard TA is bull markets are over the 200 day SMA and bear markets are below the 200 day SMA. We've been below the 200 day SMA twice in the last two years and rebounded.
-- The SPYs are way below the 10, 20 and 50 day SMA. That means a few things.
-- The 10, 20 and 50 day SMAs all have a downward pull for the foreseeable future.
-- The SMAs will become technical resistance rather than support
-- The shorter SMAs are in danger of dropping below the longer SMAs, adding further downward pull to the market. The 10 day SMA will for all practical purposes move below the 20 and 50 day SMAs soon. How long that lasts is anybody's guess.
-- Volume has been really heavy, indicating we have probably witnessed some sort of selling climax.
-- The markets look oversold right now. Expect a technical bounce, probably from near the 200 day SMA.