American Home Mortgage Investment Corp. shares plunged 90 percent after the lender said it doesn't have cash to fund new loans, stranding thousands of home buyers and putting the company on the brink of failure.
Investment banks cut off credit lines, leaving American Home without money yesterday for $300 million of mortgages it had already promised, the Melville, New York-based company said in a statement today. It anticipates that $450 million to $500 million of loans probably won't get funded today, and the lender may have to sell off its assets.
``They can't function without access to capital,'' said Bose George, an analyst with KBW Inc. in New York. ``The company either has to file for bankruptcy or go through some type of rescue or restructuring, and either way will leave almost nothing for the common shareholders.''
And here's the result:
U.S. stocks fell after troubled American Home Mortgage Investment Corp. said it lacks cash to fund new loans and traders speculated Apple Inc. will cut production of its widely touted iPhone. The Standard & Poor's 500 Index posted its biggest monthly decline in three years.
Lehman Brothers Holdings Inc., Bear Stearns Cos. and Goldman Sachs Group Inc. led the brokerage industry to a 10-month low because the prospect of American Home liquidating assets threatened to depress the value of mortgage securities traded on Wall Street. The concern that Apple overestimated demand for its unique mobile telephone helped send the S&P 500 Information Technology Index to its lowest level since March.
The Dow Jones Industrial Average erased a gain of 140 points and fell 146.32, or 1.1 percent, to 13,211.99. The S&P 500 slipped 18.64, or 1.3 percent, to 1455.27. The Nasdaq Composite Index slumped 37.01, or 1.4 percent, to 2546.27.
``Anyone invested in the market is struggling because their portfolio is underperforming and they are wondering how long this is going to last,'' said Sam Rahman, who oversees $1.3 billion as head of U.S. equities at Baring Asset Management Inc. in Boston.
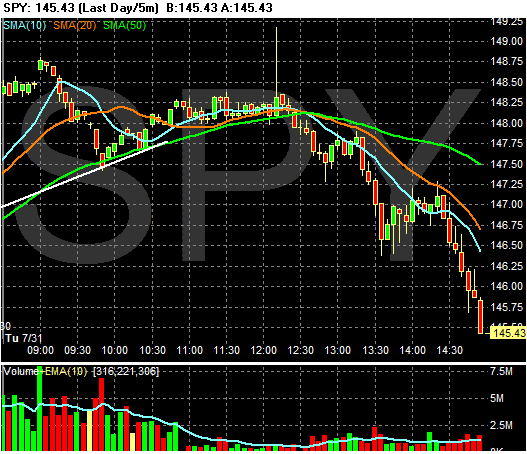
Let's see what the charts look like. The daily, 5-minute chart shows the damage from the announcement. The only good thing about this chart is the lack of big volume spikes on the way down.

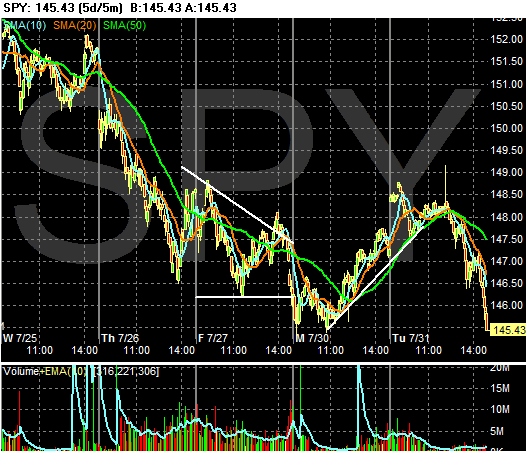
Here's the 5-day, 5-minute chart. We're right back where we were at the beginning of the week.

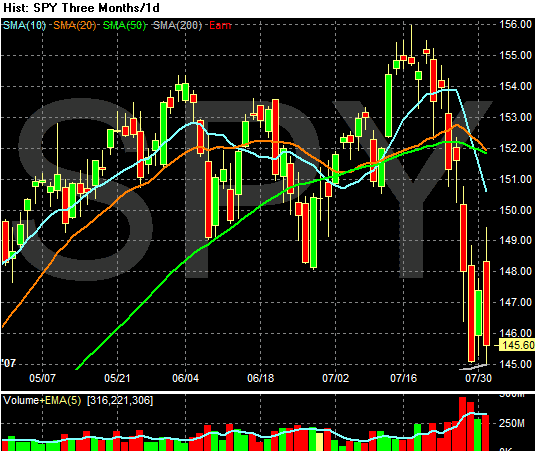
And here's the three month chart. Again, about the only good thing about today's sell-ff is the volume spike wasn't as high as the end of last week and the SPYs are still above the 200-day SMA.
