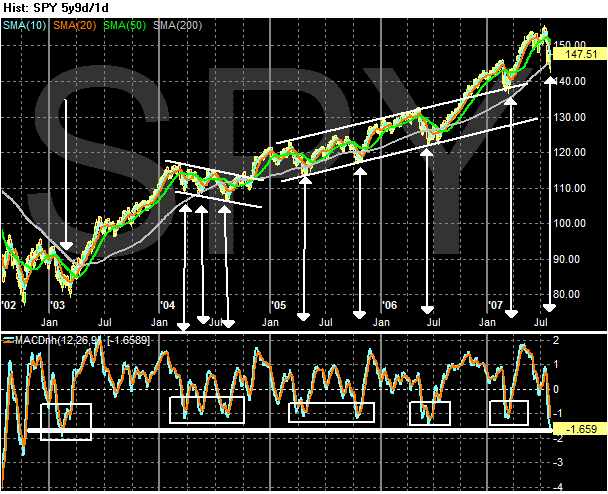
Here's the daily chart with the MACD.

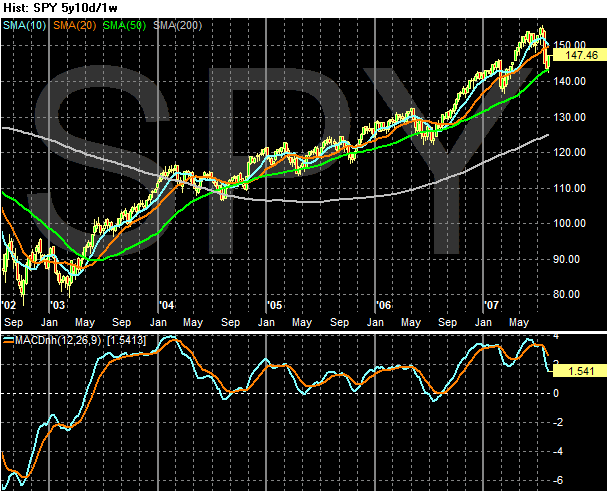
And here's the weekly chart with the MACD:

Both of these charts are giving short term buy signals. The daily MACD is very oversold and the weekly MACD is slightly oversold (although it clearly has a the possibility of downward pressure as well).
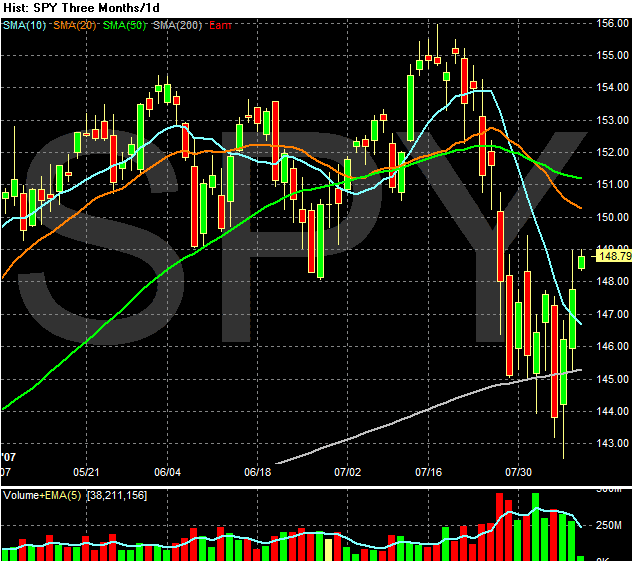
Also note the average is moving up from the 200 day SMA consolidation.

But, there are some serious fundamental problems that have finally broken through into public consciousness -- namely, the entire credit mess is now out in the open. More news along those lines and we've got downward pressure on the averages.
So, don't be surprised by an upward move. Just don't expect it to last. I'd be eyeballing the 20 and 50 day SMA as initial resistance. Also note that using the weekly MACD, we have about 3-4 weeks of positive upward moves in the mix (this assumes the the previous MACD high is a peak for the current rally).