First, I wanted to include one more long-term chart. This one uses Fibonacci fans. Notice the SPYs bounced near support from these fans.
Let's go to a three-month chart to see the Fibonacci levels from the previous sell-off. Notice the 61.8% line correspond (more or less) to the 20 and 50 day SMA.
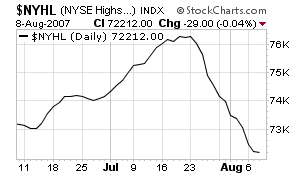
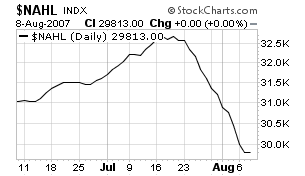
Here are two more charts that show why I think this is a bounce rather than a rally. Here is the new high/low chart for the NYSE and NASDAQ respectively. Notice they are still heading south. Granted, these aren't going to be showing good points for a bit because of the recent sell-off, but they're still moving lower.
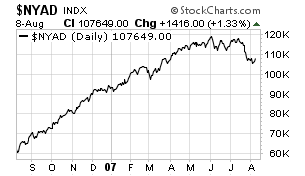
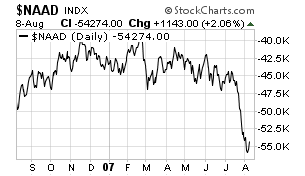
Also note the advance decline line for the last year for the NYSE and NASDAQ, respectively. These are still in the dumps and will have to show a heck of a lot more upward movement for this to be a rally rather than a bounce.
Now for one more little mini-section. Here's a 2-day, 5 minute chart of the markets. Notice the market once again had a ton of volatility. Late session buying brought the index back up, but the drop starting about 1:30 which completely wiped out the days gains indicates there is still a ton of nervousness in the markets.