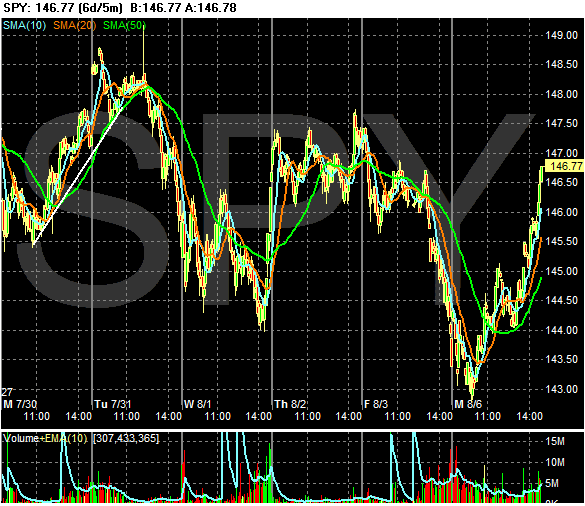
But here's the 6 day chart going back to last Monday. Notice the SPYs are trading in a range with a slightly downward bias.
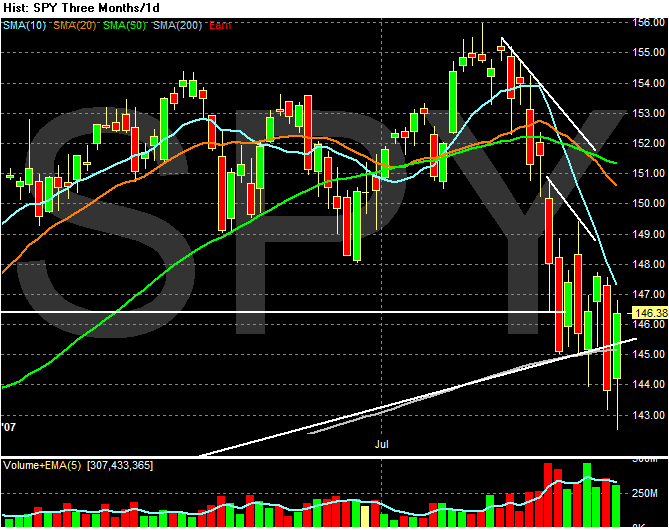
And here's the big issue -- the 3 month SPY chart. Notice how the average is trending down right now. We're also seeing a pattern of lower lows and lower highs, which is never a good sign.
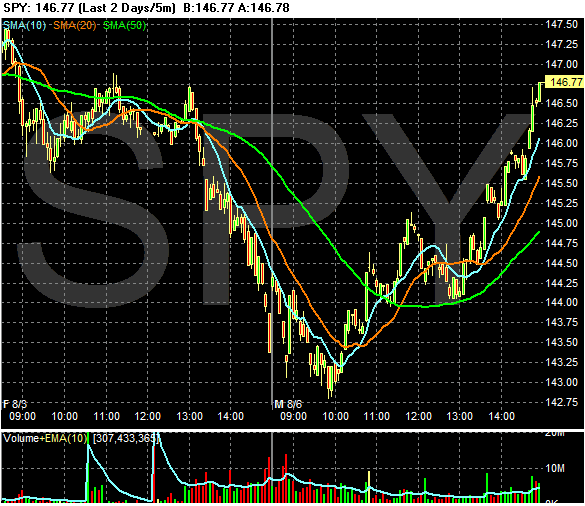
Short version -- while today's rally was good news, we're not out of the woods by a long shot.