Let’s review the general economic background. According to the Bureau of Economic Analysis, US GDP increased 5.6% in the first quarter, 2.6% in the second quarter and 2.2% in the third quarter. The BEA revised third quarter GDP up from 1.8% to 2.2%. However, the three quarter trend is clear: growth is slowing.
Housing is in a slump. The Federal Reserve made the following comment in its FOMC statement on December 12:
Economic growth has slowed over the course of the year, partly reflecting a substantial cooling of the housing market. Although recent indicators have been mixed, the economy seems likely to expand at a moderate pace on balance over coming quarters.
The employment picture is statistically solid:
Nonfarm payroll employment rose by 132,000 in November, and the unemployment rate was essentially unchanged at 4.5 percent, the Bureau of Labor Statistics of the U.S. Department of Labor reported today. Job gains continued in several service-providing industries, including professional and business services, food services, and health care. Employment declined in construction and manufacturing.
Hourly wages have actually increased through November of this year. So far, hourly wages increased from $16.40 in January to $16.91 in November for an increase of 3.1%. Over the same period, the inflation index increased from 198.3 to 201.5 for an increase of 1.61% making wage gains 1.49%. However, this is the first year of this expansion when wages have increased faster than inflation. So this is good news, but it will take a bit of time for 80% of the population to start making money beyond inflation. However that may prove difficult in a 2.2% GDP growth rate environment.
So using the above metrics we see the US is in a low-unemployment situation with increasing wages. But growth is slowing and the housing market is slumping. In other words, it is more likely the slow growth environment will continue, especially considering a slumping housing market. So the US economy is technically in good shape, but certainly not something to write home about.
Let’s turn to the markets. Below are point and figure charts for the Dow Jones Industrial, S&P 500 and NASDAQ. These charts are designed to show major price movements, essentially filtering out the statistical noise from day-to-day price fluctuations. The numbers and letters you see on the chart symbolize months, with the letters A, B and C symbolizing October, November and December. The charts are from Stockcharts, which is a really good website for technical information. When looking at the charts below, pay particular attention to the volume bars in the lower part of the chart.
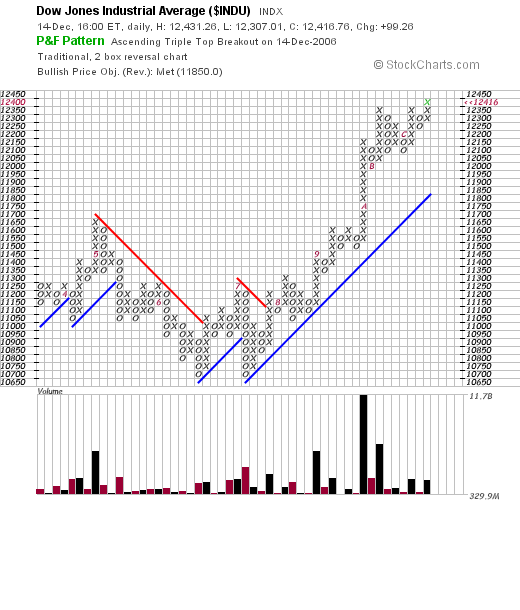
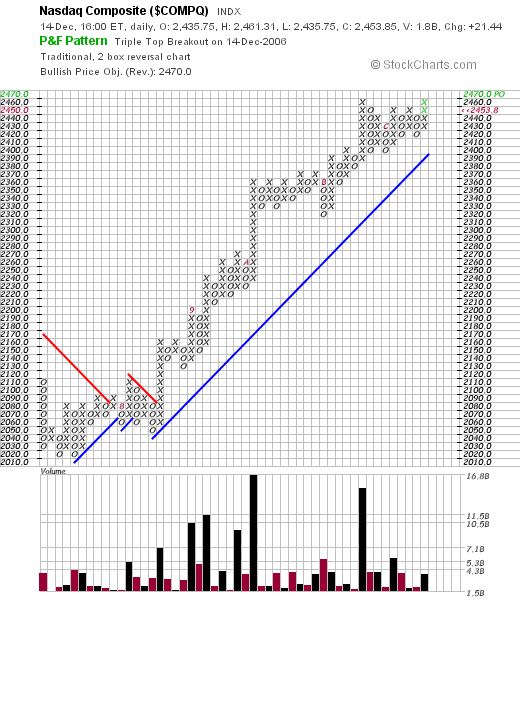
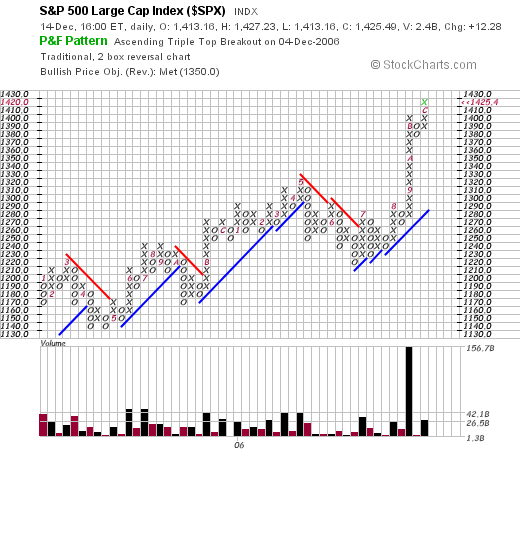
With the Dow chart, notice how the total traded volume doubled in the rally from August to September. With the S and P, notice how the volume increased 1.5 times for the latest rally. And with the NASDAQ notice we have two very large volume bars for the September rally and 1 for the October rally. With each average we have a big total volume increase during the latest rally that is at the least 1.5 times as large as other rallies.
The last time the markets had a strong rally was from March 2003 to early 2004. 10-week bar average volume of the SPYs was right around 216 million. In the current rally, that number is right around 366 million – 1.7 times the 2003 number. Those same numbers for the QQQQs were 414 million and 564 million. While the QQQQ recent volume increases aren’t as large as the SPYs, they are higher.
This leads to a few questions. First – where is this volume coming from? For the last 4-6 months, the Federal Reserve has been using a ton of repo agreements increase money supply via M3. That would explain some of the volume. The latest TIC data indicates foreigners have increased their purchasing of equities. Through October of 2005 they had purchased 83.6 billion of securities, whereas they had purchased $114 billion through October 2006. This is a net increase of 37%.
But more importantly is this observation from the great trader W.D. Gann. He divided market developments into 7 phases, one of which was The Third Zone, or the highest above normal marks. Basically, everybody is buying, everybody is talking about how wonderful the market is, the market continues to advance for a period of weeks or months and people get “too full of hope to sell.” These areas of the market are easy to identify -- after prices fall. While it’s going on it’s hard to discern exactly what is happening.
So – are we in this third zone? The length of the rally and the large increase in volume compared to the 2003 rally would indicate the possibility is higher. In addition, we have a slowing economy, a troubled housing market, oil under upward pressure from OPEC production cuts and a falling dollar – all of which are bearish. On the plus side, unemployment are statistically low and hourly wages are increasing after inflation for the first time during this expansion.
Technical analysis is not a science. just because the events say something will probably happen does not mean it will happen. However, right now we have a higher probability of the markets nearing a top.