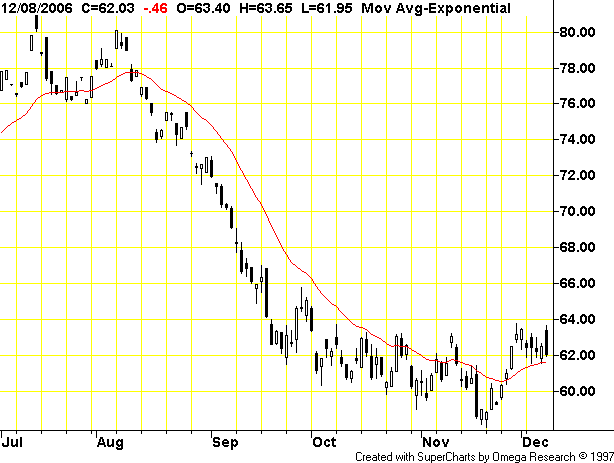
Above is a weekly chart for oil. It shows that oil peaked around $80/bbl in August and has been coming down in price since then. At the beginning of October oil went into a trading range between roughly $60 and $64. Anytime you see any security, commodity, future, whatever in a trading range, it indicates supply and demand are near equal. Traders think these prices are more or less fair for oil. Nothing has happened that would alter that fundamental perception.
What makes this interesting is OPEC announced production cuts this fall. There have been several news stories that OPEC is considering another production cut as well. However, this news hasn’t been enough to move oil higher. There are two reasons for this. First, OPEC is notoriously undisciplined – member states have routinely broken previous production quotas. Secondly, the US economy is slowing indicating US demand for oil may decrease. Therefore, prices of $80/bbl are unwarranted given the current US economic situation. Starting at the beginning of November, you see oil form a reverse head and shoulders formation. This could indicate the end of the trading pattern for oil. However, as with all technical analysis, it’s important to look at the fundamental situation to see if that makes sense (we’ll get to that in a minute).
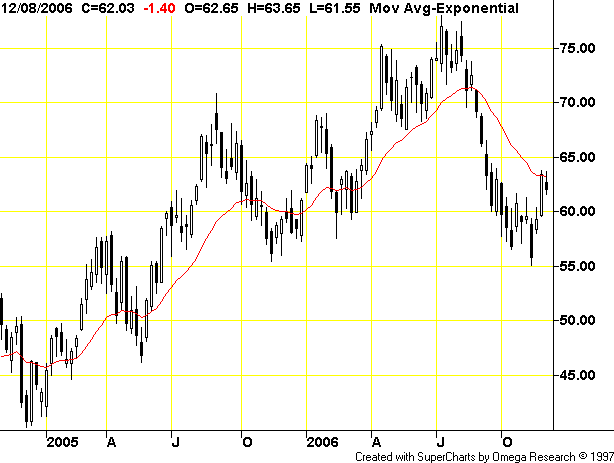
Now, let’s go to a longer chart, this one with weekly bars.
There are two ways to look at this chart. The first is as a decline starting just after July, with a reaction move (or an upward rally) starting four bars from the right. Or, you can look at the formation starting in October as a rounding bottom of the downtrend that started in late July. Either interpretation indicates something new is probably about to happen.
However, the fundamentals don’t provide a strong signal either way. According to the latest This Week in Petroleum from the Department of Energy overall crude oil stocks are far above the average range. In addition, we have this:
The first major cold front of winter crossed much of the country last week, beginning with snow in Seattle during Monday Night Football, continuing with several inches of snow in parts of the Midwest by Thursday, and followed by cold, windy weather along the East Coast this past weekend and the first part of this week. In much of the country, anyone walking their dog at night, recently, understands that winter has arrived. And, as predicted, higher oil prices have arrived with the colder weather.
Colder weather is a net positive for the market, as it means winter fuel needs will increase. In addition, distillate stockpiles are decreasing, lowering overall supply.
The US has large stockpiles of oil and its economy is slowing. This is net oil negative. However, we have the cold front which is net oil positive. So, we come up with the following guesstimate:
A roughly 10% chance of oil dropping below $60. The market has had plenty of reasons to drop the price further – OPEC, a slowing US economy and consistent US stockpiles – and hasn’t. Clearly, $60/bbl provides strong support for the current background. It will probably take a change in the overall economic picture to lower prices below $60/bbl.
Chance of remaining in the current range – 45%. The market has also had good reason to drive the price up – again the OPEC production cut and the current cold front --- but hasn’t. Clearly, traders like the current range.
Chance of breaking trend – 45%. There are myriad reasons for a break above the current levels. Weather is one. Traders looking at the chart and seeing the upside down head and shoulders formation and buying on that is another.
Here is the one thing to take away from this: technical analysis is not an exact science. You can get a feel for the general direction of the market. But, the market will always do its very best to humble you at every turn.

