Tuesday, May 27, 2008

Are Beef Prices Headed Higher?

From Blomberg:

Enjoy your next steak, because prices from Shanghai to San Francisco are only going up.

The highest corn prices since at least the Civil War, based on Chicago Board of Trade data, mean U.S. feedlots are losing money on every animal they sell, discouraging production as rising global incomes increase meat consumption and a declining dollar spurs exports. Cattle may rise 13 percent by the end of the year on the Chicago Mercantile Exchange and Brazil's Bolsa de Mercadorias e Futuros, futures contracts show.

Not since 1996, when corn reached what was then a record $5 a bushel, have cattle been this cheap relative to their primary source of feed. Cattle are the seventh-worst performer of the 26-member UBS Bloomberg Constant Maturity Commodity Index in the past year, a time when soybeans, oil and copper jumped to records. After adjusting for inflation, cattle are down 27 percent from their 1988 peak.

``It's pretty certain that we'll see a decline in domestic supply in the U.S.,'' Joesley Batista, chief executive officer of JBS SA, the world's biggest beef producer, told reporters in Sao Paulo on May 15. ``As a result, we'll have price hikes and improved margins.''


Agricultural/food price inflation has been a hot topic over the last few months. I've been concerned about the long-term spike in prices for about 6-9 months. This is just another symptom of the underlying problem: as the world's standard of loving increases (think India and China making more and more money) people will want better things like steak.

So, let's take a look at a few charts.


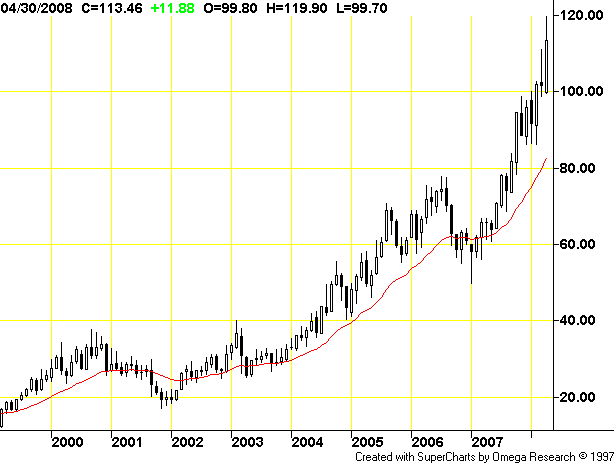
On the monthly corn chart, simply notice the huge price spike that's occurred.


On the weekly chart, notice the following:

-- Prices rallied from the summer of 2006 to the beginning of 2007

-- Prices consolidated gains until the fourth quarter of 2007

-- Prices have been rallying strongly since the fourth quarter of 2007


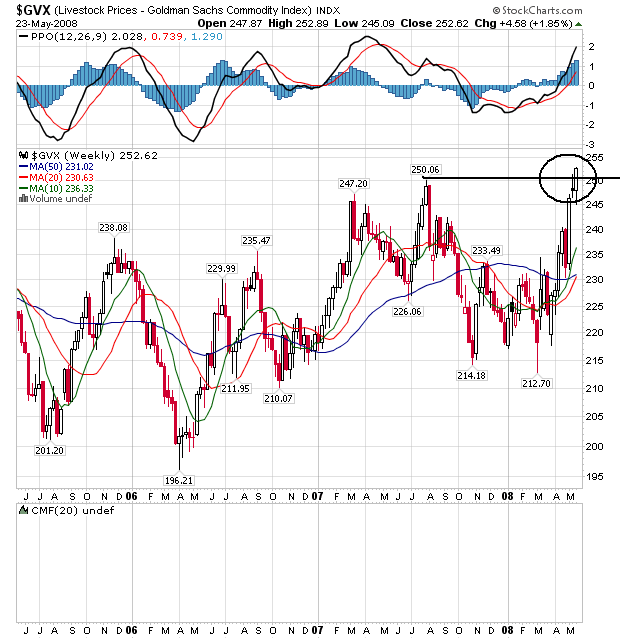
On the weekly livestock chart, notice that prices have been meandering for the better part of two years. But also note that prices have recently moved through a key area of resistance.


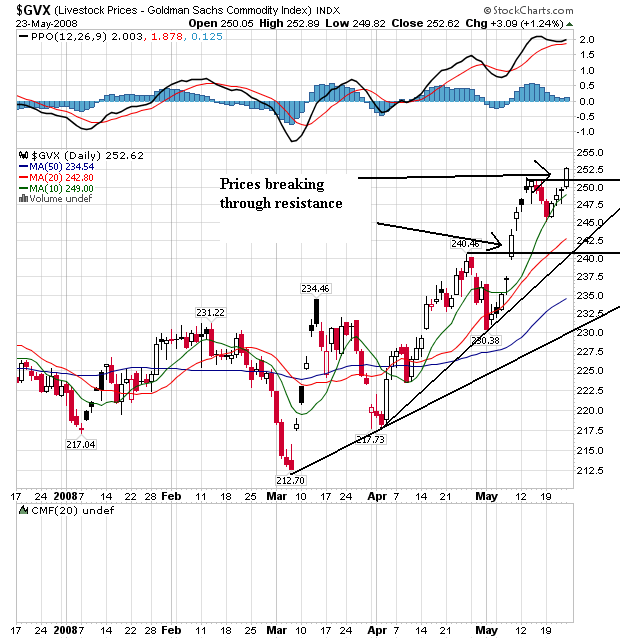
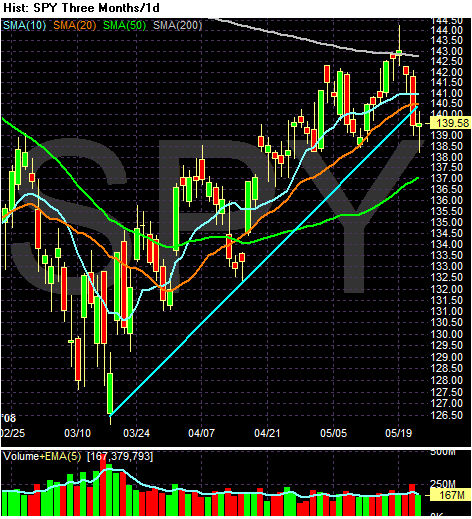
On the daily chart, notice that prices have been rallying since the beginning of March, with prices continually moving through key resistance levels. Also note that the shorter SMAs are higher than the longer SMAs, that all the SMAs are moving higher and that prices are higher than the SMAs. This is a bullish chart.

We're Nowhere Near A Bottom in Housing

From IBD:

What should prospective real estate investors be watching to catch the inevitable upturn?

Sales and home construction have to stop falling, but that's only a first step, analysts say. The glut of unsold housing has to come down sharply before prices can bottom. And like the stock market, price is often your best indicator about real estate's direction.

Real estate slumps are usually local affairs, reflecting natural disasters or regional economic troubles. But the subprime lending crisis has resulted in the first nationwide home-price decline since the Depression by some measures.

States where sales, construction and prices rose most during the lax lending era will take longest to recover, analysts say. Many are located in the West, such as Arizona, Nevada and California.

The last time Western states suffered a real estate slump was in the late '80s and early '90s after the savings and loan crisis and Federal Reserve rate hikes choked off credit.

In the West, existing-home sales peaked in late 1988 and bottomed in December 1990, with a sluggish, uneven recovery. New housing starts peaked in January 1990 and bottomed in March 1991.

.....

Builders have slashed housing starts by 55% from their January 2006 top. Total unsold new properties have fallen. But that's been overwhelmed by weaker sales and foreclosed homes flooding the market.

Unsold existing homes soared to 11.2 months' worth at the April sales pace, NAR said. The inventory ratio for single-family homes was the highest since 1985.

"You need to get that down to a five-month range for prices to stabilize," Wheaton said.


Economics is not rocket science; it's actually a very simple, common-sense affair after you cut through all the damn noise and spin. Too much of something means the price of that something will go down. That means we've got a huge problem for home prices (graph is from Calculated Risk):


In addition, the months of available supply number is spiking as well (graph is from Calculated Risk):


And as a result of all that inventory, prices are dropping (from the Big Picture):


Also consider this news from today:

Prices of single-family homes plunged a record 14.1 percent in the first quarter from a year earlier, marking a pace five times faster than the last housing recession, according to the Standard & Poor's/Case Shiller national home price index reported on Tuesday.

The S&P/Case Shiller composite index of 20 metropolitan areas fell 2.2 percent in March from February and plummeted a record 14.4 percent from March 2007.

Economists expected prices for the 20-city index to fall 2.0 percent on month and 14.0 percent from a year earlier, according to the median forecast in a Reuters survey.

"There are very few silver linings that one can see in the data," David Blitzer, chairman of S&P's index committee, said in a statement.


And new home sales aren't doing much better:

Sales of newly constructed single-family homes rose 3.3 percent in April to a 526,000 annual rate but they were down 42 percent from a year ago, which was the largest year-over-year drop in nearly 27 years, government data on Tuesday showed.


And who is going to buy these homes?


Consumer confidence is low, as is


Consumer sentiment


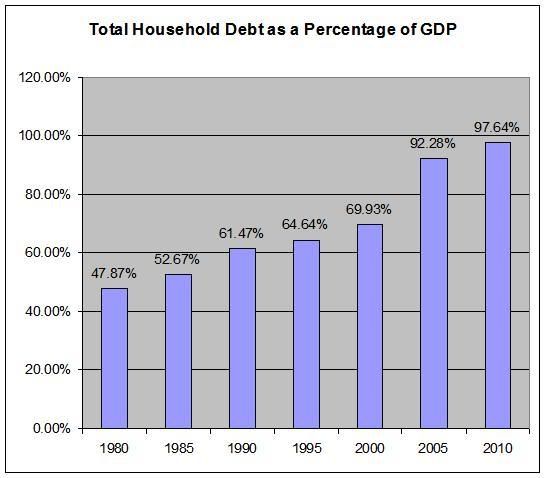
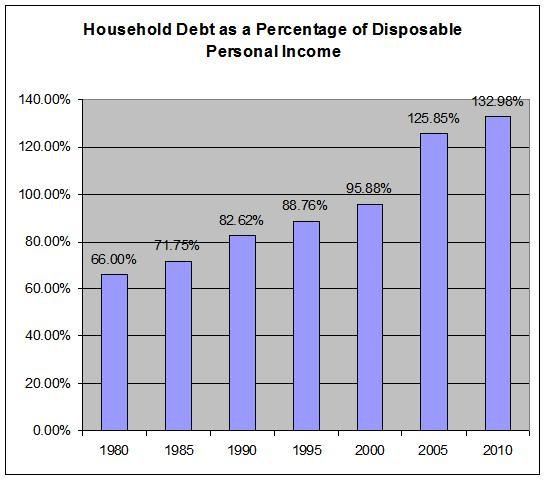
And consumers have already taken on as much debt as they can handle.

So -- anyone calling a bottom in housing is completely ignoring the fundamentals.

-- Inventory is still surging and will be for the foreseeable future with foreclosures spiking

-- Consumers already have a ton of mortgage debt on their books, leading to

-- price declines.

Monday's Market Round-Up

Except it's on Tuesday. I will be doing the Treasury market tomorrow.

Although the markets were rallying for the better part of the last two months, the technical picture has changed. To demonstrate this, I'm going to use line charts to filter out some of the noise.
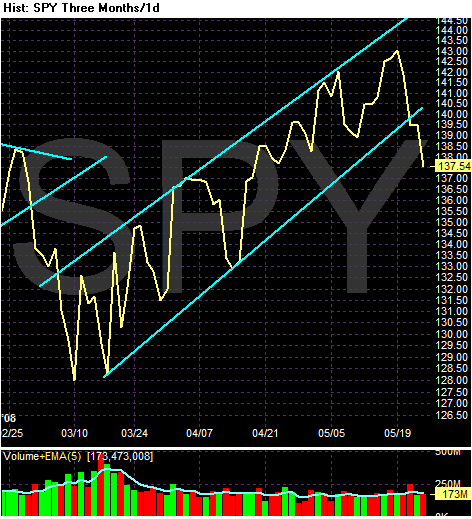


The SPYs have clear broken their support line.
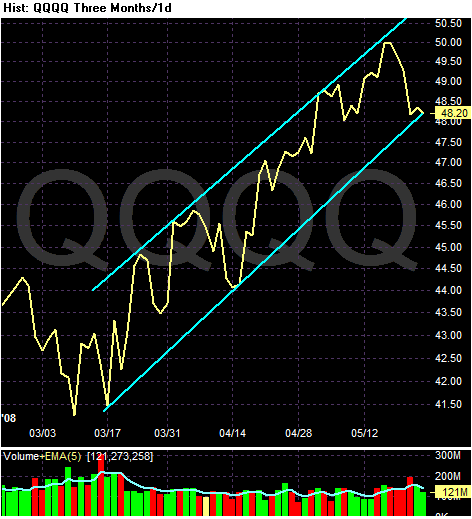


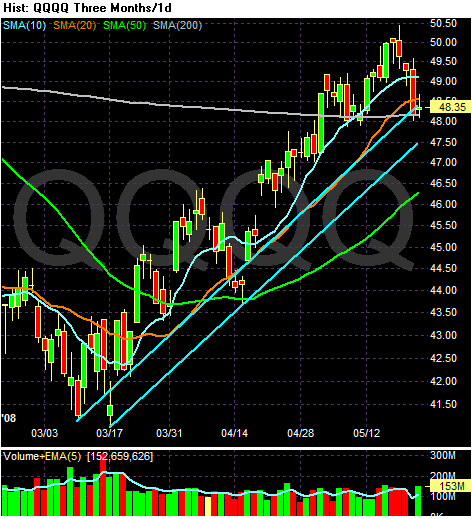
The QQQQs are just barely hanging on.
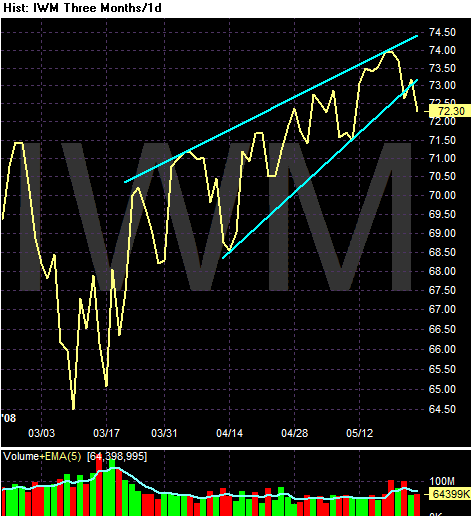


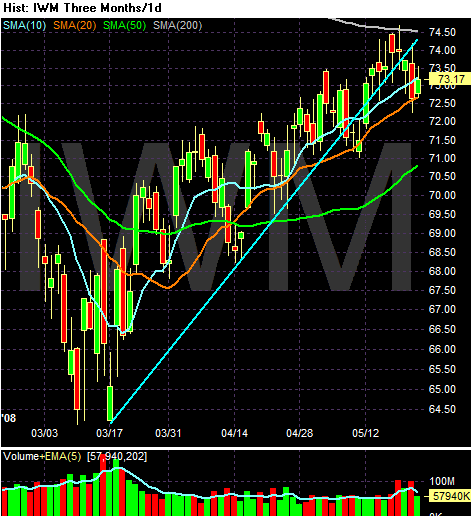
The IWMs have broken support, and
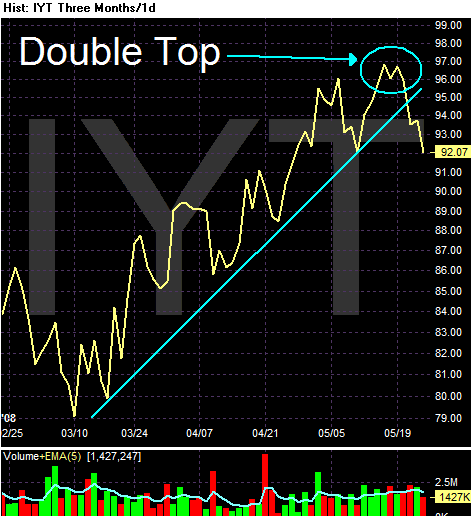


The transports have also dropped through support.

Now, let's look at the candle charts and SMAs to see what they say.
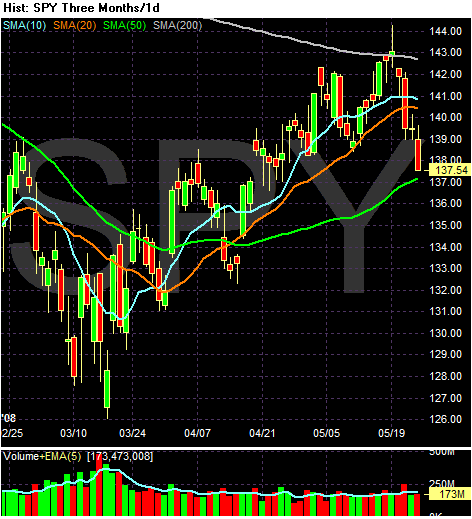


On the SPYs, notice the following:

-- Prices hit the 200 day SMA and retreated

-- Prices have moved through the 10 and 20 day SMA.

-- The 10 and 20 day SMA have turned horizontal

-- The SMAs are still in a very bullish alignment, with the shorter SMAs above the longer SMAs, BUT

-- Pries are now below the two shorter SMAs which will drag them down.
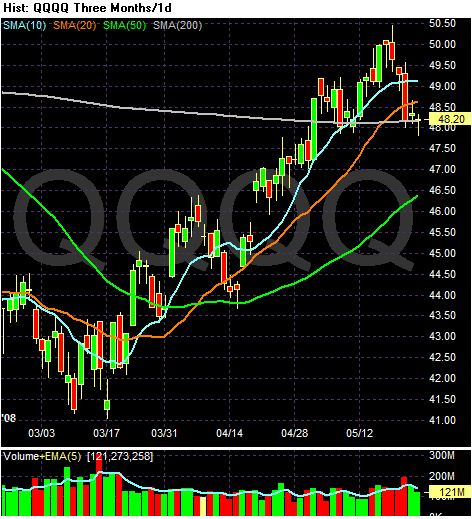


On the QQQQs, notice the following:

-- Prices are below the 10 and 20 day SMA and

-- Prices are right on top of the 200 day SMA

-- The 10 day SMA has turned sideways

-- The SMAs are still in a very bullish alignment, with the shorter SMAs above the longer SMAs

-- However, with prices below the 10 and 20 day SMAs, the shorter SMAs will be coming down.
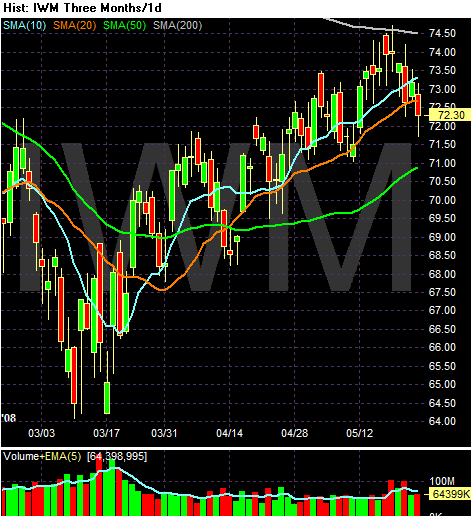


On the IWMs, notice the following:

-- Prices are below the 10 and 20 day SMA, which will pull these SMAs lower

-- Prices approached the 200 day SMA and couldn't break through upside resistance

-- The shorter SMAs are still in a very bullish configuration with the shorter SMAs above the longer SMAs.
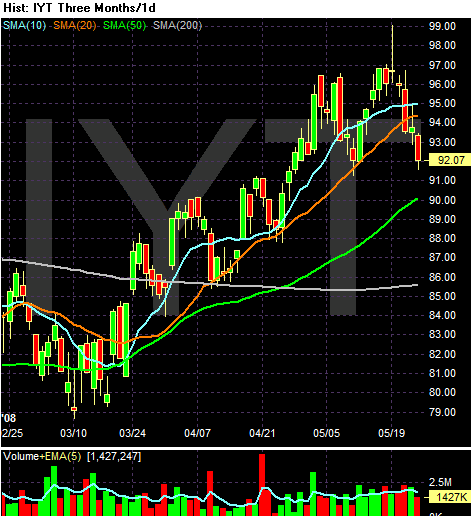


On the transports (IYTs), notice the following:

-- Prices fell through the 10 and 20 day SMAs

-- The SMAs are still in a very bullish alignment, with the shorter SMAs over the longer SMAs

-- Prices are also above the 200 day SMAs.

Regarding last week's charts, notice the following:
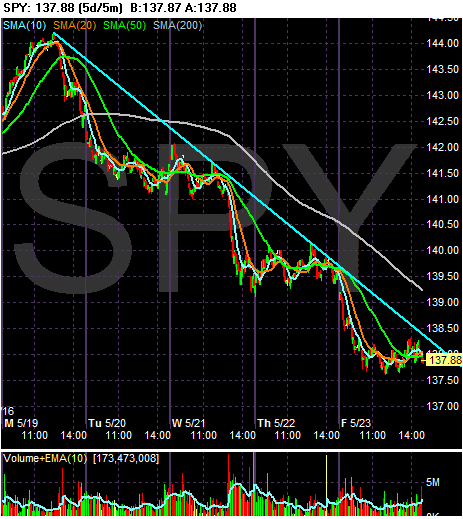


The SPYs were in a clear, week-long downward trajectory.
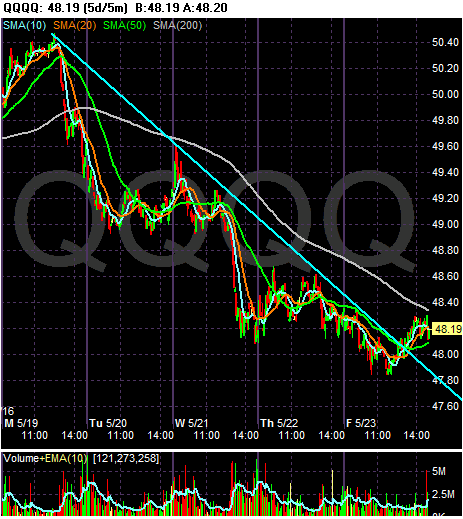


The QQQQs were also in a clear downward trajectory, but broke through upside resistance about halfway through the trading day on Friday.
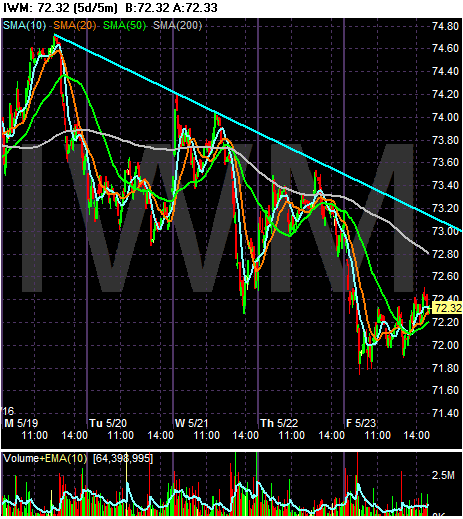


The IWMs were also in a clear downward trajectory.

So -- what led to this bug turn of events? The Federal Reserve summed it up in the minutes of their latest meeting. Here's the opening paragraph of the recently released minutes from the April 29-30 meeting:

The information reviewed at the April meeting, which included the advance data on the national income and product accounts for the first quarter, indicated that economic growth had remained weak so far this year. Labor market conditions had deteriorated further, and manufacturing activity was soft. Housing activity had continued its sharp descent, and business spending on both structures and equipment had turned down. Consumer spending had grown very slowly, and household sentiment had tumbled further. Core consumer price inflation had slowed in recent months, but overall inflation remained elevated.


Let's see how accurate the Fed's statements were. The Fed's statements are italicized.

indicated that economic growth had remained weak so far this year


According to the Bureau of Economic Analysis, GDP grew at a .6% pace in the fourth quarter of 2007 and the first quarter of 2008. And that assumes that inflation is correctly calculated.

Labor market conditions had deteriorated further
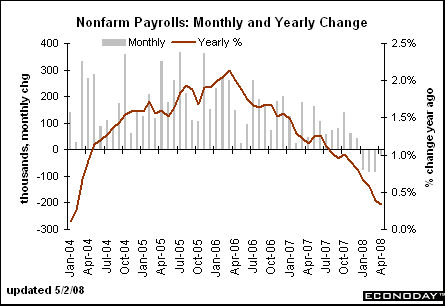


Year over year job growth has been deteriorating for some time and
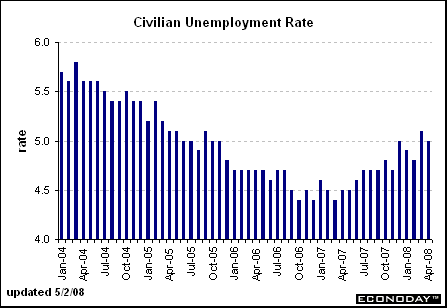


The unemployment rate is ticking up.

manufacturing activity was soft
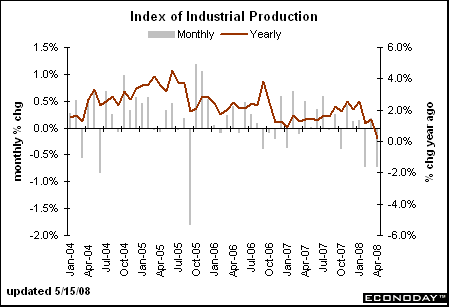


On a year over year basis, industrial production has been dropping since the end of last summer.
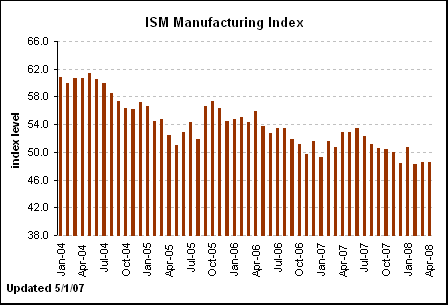


And the ISM manufacturing index has been below 50 for a few months, indicating a contraction in manufacturing activity.
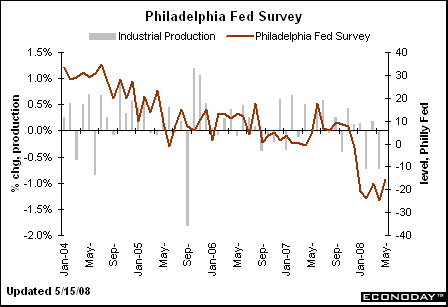


The Philadelphia Fed survey has been weak for some time, as has
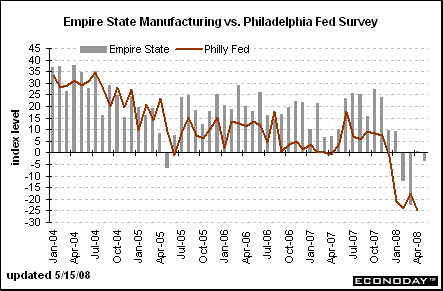


Empire state survey

Housing activity had continued its sharp descent


From the WSJ:

Prices fell an average of 1.7% nationwide in the first quarter from the final three months of 2007, according to the Office of Federal Housing Enterprise Oversight. The decline was the largest in the index's 17-year history. The government index, which is seasonally adjusted and based on data for home purchases, had dropped 1.4% in the prior quarter. Compared with a year earlier, home prices dropped 3.1% in the first quarter.

.....

Other nationwide indexes show steeper declines. The S&P/Case-Shiller index, which includes a broader variety of mortgages and which showed a nationwide drop of 8.9% in the fourth quarter from a year earlier, is set to release first-quarter figures next week.


From the Fed again:

business spending on both structures and equipment had turned down


According to the latest GDP report from the Bureau of Economic Analysis, business investment in "structures" decreased 6.7% last quarter and investment in software and equipment decreased .7%.

Consumer spending had grown very slowly
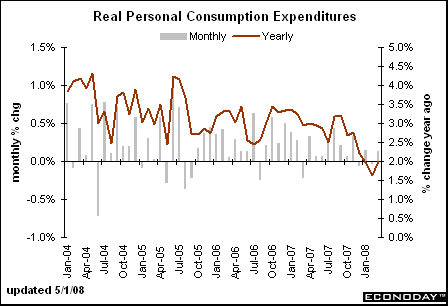


While personal consumption expenditures increased on a year over year basis last month, notice they are still hovering at the lowest levels in 4 years. Now -- ask yourself what record prices are the pump will do to this number?

household sentiment had tumbled further
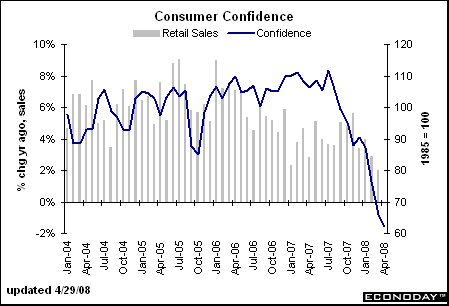


Consumer confidence has fallen off a cliff, as has
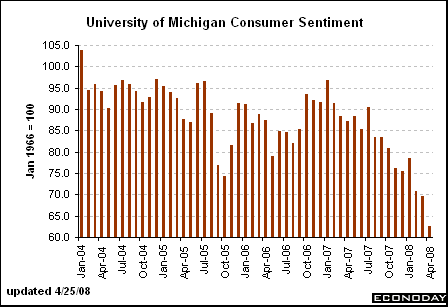


Consumer sentiment

Core consumer price inflation had slowed in recent months, but overall inflation remained elevated


There is good news here.
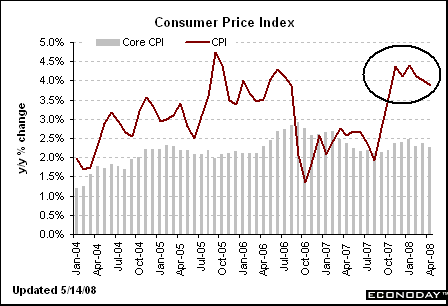


On a year over year basis, CPI as steaded and perhaps is starting to come down a bit, as is
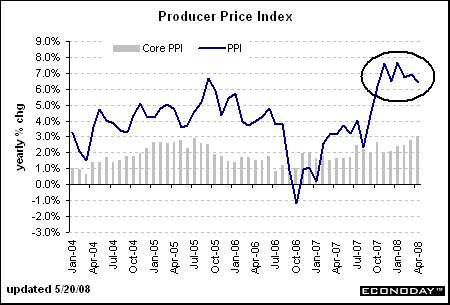


PPI

But that's the only good news in the Fed's statement.

To sum up, the Federal Reserve said, quite simply, that the economy is in terrible shape. In addition, the Fed lowered their growth rate projections.

Monday, May 26, 2008

Back Tomorrow

The markets are closed today. I'll be back in the morning.

Friday, May 23, 2008

Weekend Weimer and Beagle.

It's that time of the week again. Take a break from the markets are have yourself a weekend. See you on Monday.


We're Nowhere Near the Bottom In Housing, pt II

From Bloomberg:

The number of previously owned unsold homes on the market at the end of April jumped to 4.55 million, up from 4.12 million in March. The total represented 11.2 months' supply at the current sales pace, the highest on record and up from 10 months at the end of the prior month.


This is a super-glut. Combine this with the price news from earlier today and you have big problems. Still.

US Auto Makers -- Dumb As a Bag of Rocks

First, here is a long term chart of oil:


Does anybody see a trend here? Anybody? It sure looks to me like oil is in the middle of a multi-year bull market, intensified by the economic growth of two of the worlds largest countries India and China. For those of you in the economic forecasting department at Ford that's called "an increase in demand" and it means prices will go up. At some point prices will become so high that people might want to purchase a more fuel efficient vehicle, like say a Prius.

Toyota Motor Corp (7203.T: Quote, Profile, Research) said on Thursday that cumulative sales of its Prius hybrid car had topped 1 million units worldwide since its launch just over a decade ago.

The Prius, the world's first mass-produced gasoline-electric hybrid car, first went on sale in Japan in late 1997 and in other markets in 2000. Toyota remains the leader in hybrid sales, with Honda Motor Co (7267.T: Quote, Profile, Research) a distant second with its Civic model.

.....

By slashing production costs for the hybrid system, Toyota has said it would make the technology available across its line-up, with an aim to sell at least 1 million hybrid vehicles annually soon after 2010.


Yet, the US auto industry made their bed with ..... trucks and SUVs which aren't exactly the most fuel efficient models on the planet. As a result, we get stories like this:

Ford Motor Co.'s plan to return to profitability got run over by a truck.

The rise of gasoline prices toward $4 a gallon is causing a major shift in the U.S. auto industry that threatens to push the Big Three auto makers and some of their rivals to a new level of peril. In recent weeks, sales of pickup trucks and sport-utility vehicles -- already falling in recent years -- took an unexpectedly sharp tumble.

Those declines triggered a surprise announcement by Ford on Thursday that it's now "extremely unlikely" the company will return to profitability in 2009, as it previously predicted. Just last month, Ford was hailed by the market after it reported an unexpected $100 million in first-quarter net income.

In a Thursday conference call, Chief Executive Alan Mulally said the industry has "reached a tipping point" and that the falling truck sales represent a long-term shift in the U.S. auto market, not a short-term dip.

"We saw real change in the industry demand for pickup trucks and SUVs in the first two weeks of May," Mr. Mulally said.

On Thursday, Ford said it will cut truck and SUV production by as much as 40% in the second half of this year, compared with the year-earlier period. Previously, Ford had hoped to get a second-half lift from the launch of a redesigned F-150 pickup truck. The F-150 is the top-selling vehicle in the U.S.


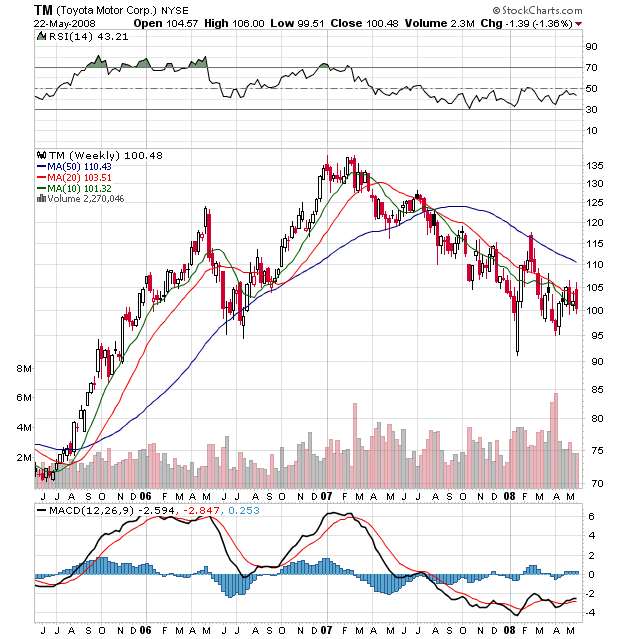
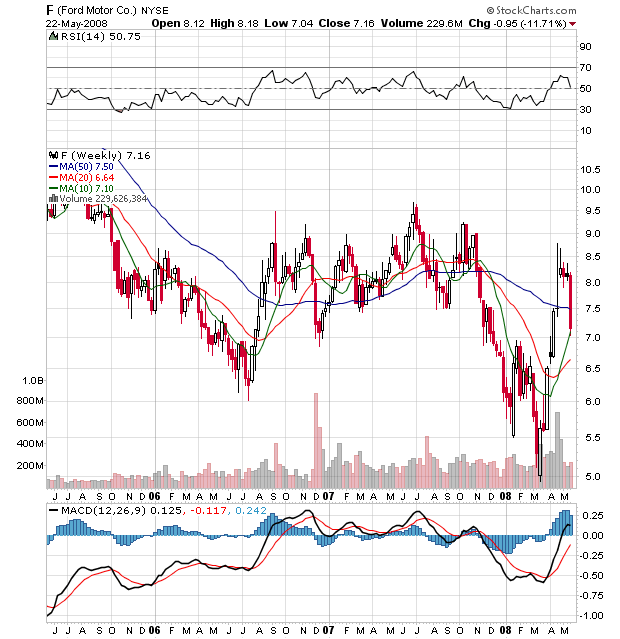
If the downfall was caused by a random catastrophe I'd have more sympathy. But this has been right in front of them for sometime now. Yet according to the article Ford was banking on a redesigned F-150 truck? At a time when Prius sales are kicking their ass? These guys deserve to fail. It also explains why Toyota's stock is at 100


And Ford is at 7.5

We're Nowhere Near the Bottom In Housing

From the WSJ:

Home prices are falling faster as the economy slows and turmoil in the mortgage markets continues.

Prices fell an average of 1.7% nationwide in the first quarter from the final three months of 2007, according to the Office of Federal Housing Enterprise Oversight. The decline was the largest in the index's 17-year history. The government index, which is seasonally adjusted and based on data for home purchases, had dropped 1.4% in the prior quarter. Compared with a year earlier, home prices dropped 3.1% in the first quarter.

.....

Other nationwide indexes show steeper declines. The S&P/Case-Shiller index, which includes a broader variety of mortgages and which showed a nationwide drop of 8.9% in the fourth quarter from a year earlier, is set to release first-quarter figures next week.

"The OFHEO report shows the weakness in the housing market, but does not, in our view, fully portray the dire state of the market," Lehman Brothers economist Michelle Meyer said in a note to clients.


Let's review the basic issues in the housing market.

1.) Inventory of existing homes is sky-high.

2.) Foreclosures are increasing, which is adding to a bloated inventory total.

3.) The US consumer's confidence is dropping, which is lowering the possibility of more home purchases.

4.) The US consumer is already in debt up to his eyeballs, meaning the possibility of him taking on more mortgage debt is pretty low.

As a result of all these factors, we get price decline headlines like the one from today. And it's not going to end anytime soon because of the 4 above mentioned data points. The best we can hope for right now is that by the end of the year we'll actually have an idea about when the market will stabilize. Maybe.

Today's Markets

Actually, this is yesterday's markets, but who's counting, right?

The big news from two days ago was the indexes dropping hard through support. Let's see how that has played out.


The SPYs are still through the 10 and 20 day SMA along with the support line started in mid-March. But yesterday the markets cooled off a bit, making today that much more important -- especially the close. If prices drop at the or near the close, we've got a big problem.


On the QQQQs, notice the average is right at the 200 day SMA -- precarious technical territory. Today's close will be very important from a technical perspective.


Notice the IWMS are still moving higher, using the 20 day SMA for support. However, the IWMS have broken their upside support a bit ago.

Friday's Forex Round-Up

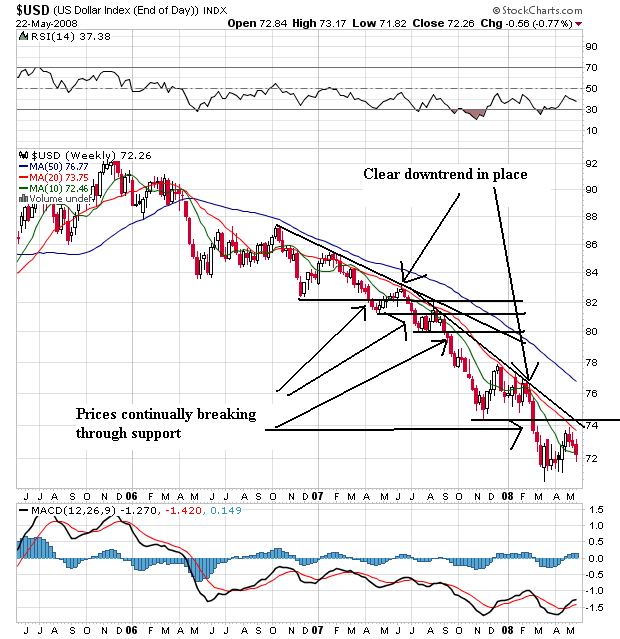
Let's start with a long-term chart of the dollar:


Remember we're dealing with an incredibly weak chart. Prices have been dropping for the better part of to years, with prices continually breaking through downside support and making new lows. This had been going on for two years -- long before the economy started to slow. That means traders saw fundamental problems with the economy long before big drops in GDP started to show up.


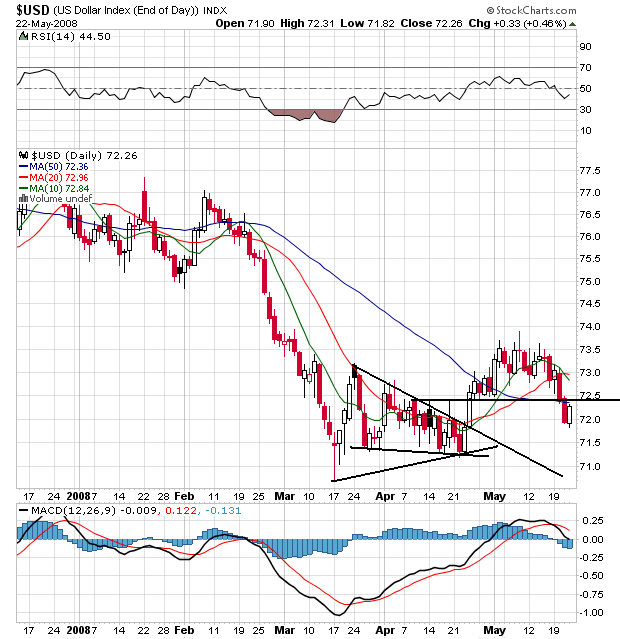
On the daily chart, notice that Prices formed a consolidation triangle from mid-March to the end of April. Then prices rallied out from that pattern. However, prices have had a hard time maintaining any upside momentum. Prices have now dropped below all the SMAs. Also note the 10 day SMA has crossed below the 20 day SMA and the 50 day SMA is at best even. A few weeks ago, the general consensus was for the dollar to rally. Now it doesn't look that hot.


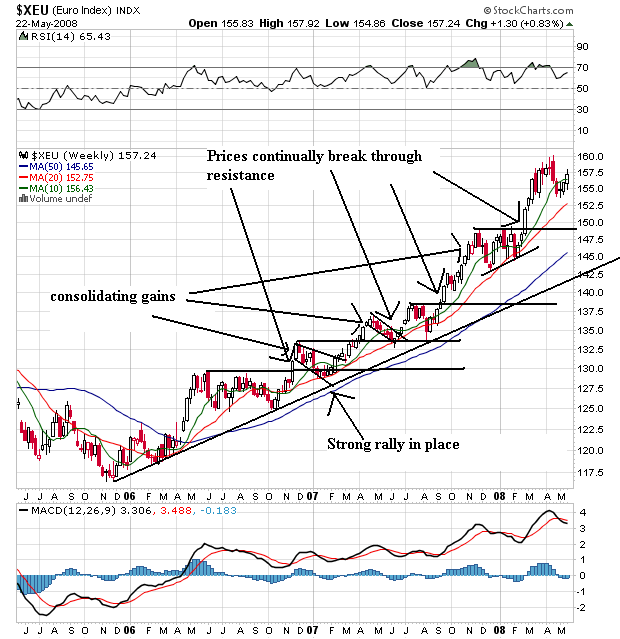
The Euro has been the direct beneficiary of the dollar's drop. Notice the euro is in the middle of a multi-year rally with a strong uptrend in place. Also notice that as prices rallied, they also consolidated their gains in several places, allowing traders to digest price action and plot their next move.


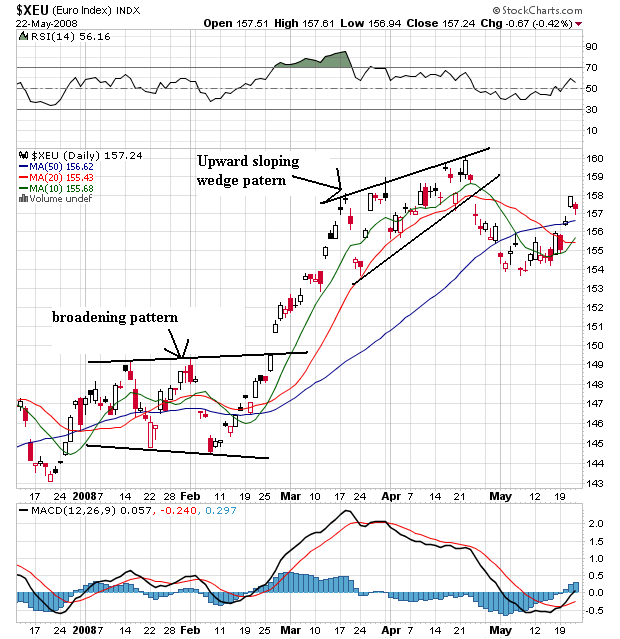
On the daily euro chart, notice the broadening pattern at the beginning of the year and the upward sloping wedge pattern from the end of March to the end of April. Prices dropped from there and fell below the SMAs. But notice how the euro has bounced back and moved through all the SMAs. Also note the 10 day SMA has moved through the 20. This chart is turning around, although it's not time to say with confidence it's completely bullish.


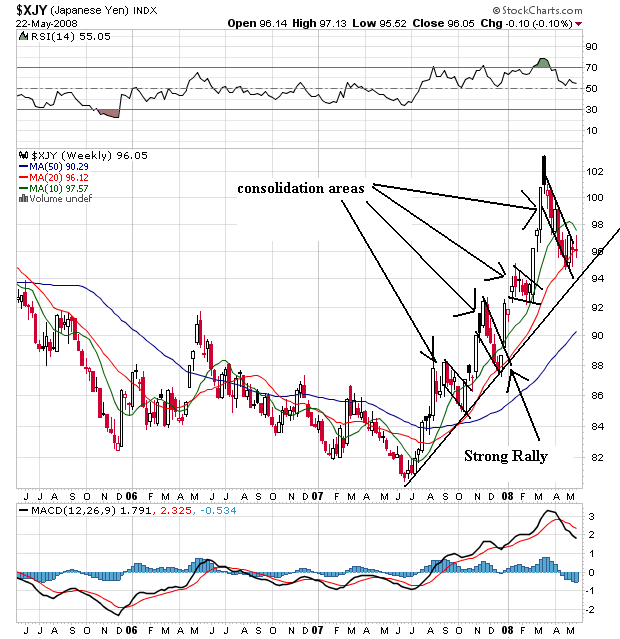
On the weekly yen chart, notice the strong rally that started in the middle of last summer -- right before the US market started to tank hard. Also notice that as prices have rallied, they have also fallen back in several triangle patterns to consolidated gains. Finally, notice how the week chart uses the 20 week SMA as support.


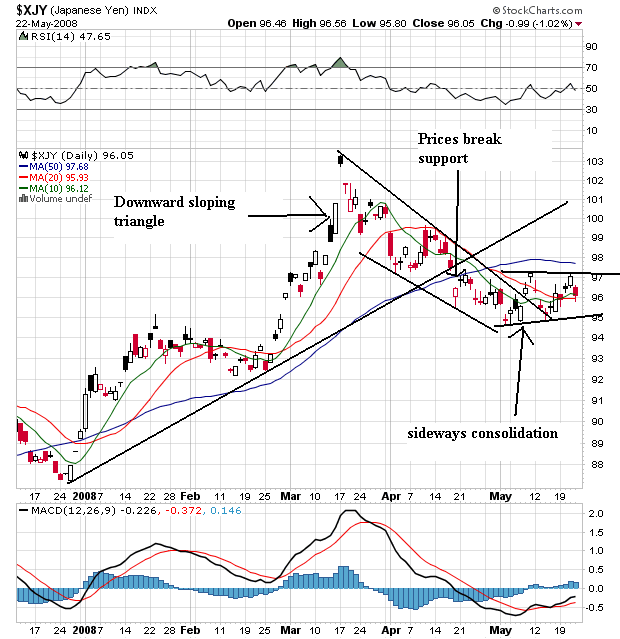
The yen broke through upside support in mid-April, but formed a solid downward sloping channel starting in mid-March. Since the beginning of May prices have been moving sideways as traders await the next big move.

So -- what can we discern from all this?

1.) The dollar's "comeback rally" isn't shaping up that well.

2.) The euro may be turning around, but we can't make a solid call yet.

3.) The yen is waiting to see what happens.

Thursday, May 22, 2008

Today's Markets

Today's markets will be posted tomorrow morning. Bonddad and Mr$. Bonddad are signing many papers as they purchase a house.

Are the Transports Forming a Double Top? or Is It Time For A Reversal?

Big kudos to Trader Mike for this catch.

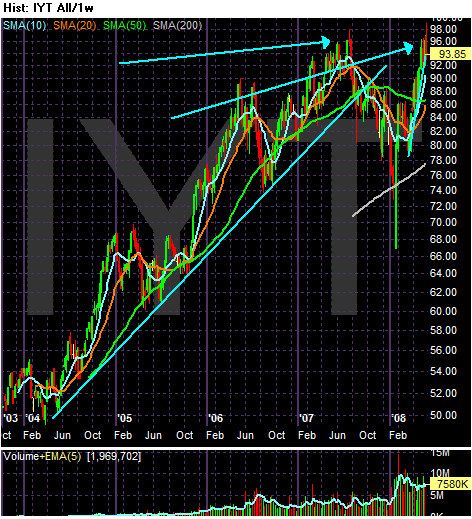
Let's start with this chart:


Each arrow is point to a possible top.

Now -- let's carry this out a bit further. Let's use Dow theory, which states the averages have to confirm each other. In other words, more than one sector of the economy has to be doing well in order for stocks to rise. So, if the economy is doing well, then transports have to rise as well.

The converse is also true -- areas of the market rise and fall with each other for various reasons.

So -- let's assume the transports are making a double top and will then drop. What does this mean for the other averages?


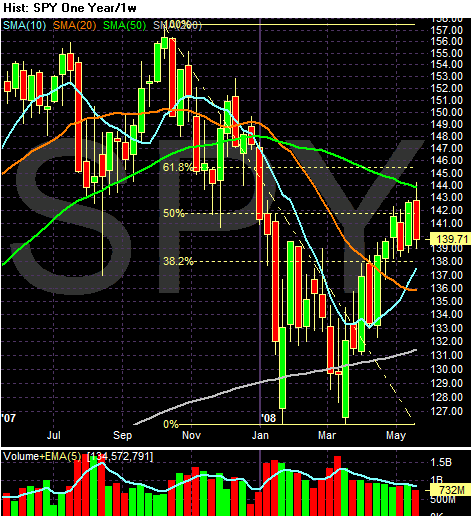
Note the SPYs have retraced about 50% of their drop from October of last year. That means the latest rally could be a solid bear market rally.


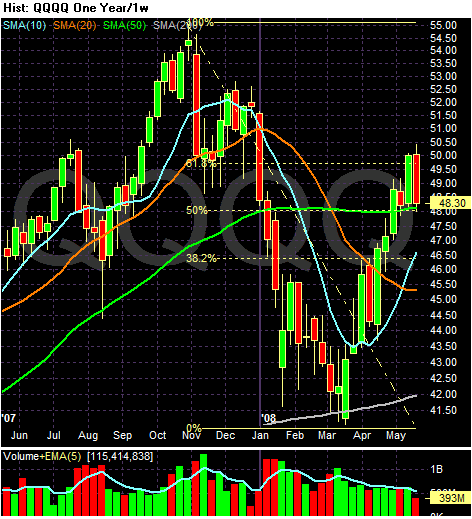
The QQQQs are at their 61.8% retracement level for another bear market rally.


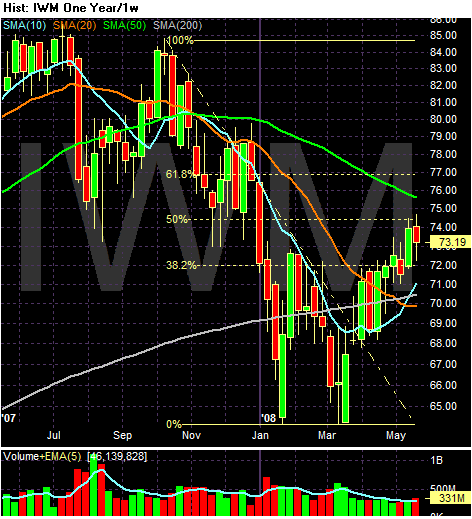
The IWMS are at the 50% retracement level.

So -- let's sum this theory up.

1.) The transports are currently forming a double top.

2.) All of the other averages are at technically important levels where traders would expect things to happen.

3.) The underlying economy is not doing that well -- at least according to the Federal Reserve:

The information reviewed at the April meeting, which included the advance data on the national income and product accounts for the first quarter, indicated that economic growth had remained weak so far this year. Labor market conditions had deteriorated further, and manufacturing activity was soft. Housing activity had continued its sharp descent, and business spending on both structures and equipment had turned down. Consumer spending had grown very slowly, and household sentiment had tumbled further. Core consumer price inflation had slowed in recent months, but overall inflation remained elevated.


In other words, the wind in the markets sails from the rate cuts and bear bail-out might be running into trouble from a badly damaged economy.