Sunday, November 18, 2007

Not the Week to Go Long

The underlying technicals of the market are deteriorating.

According to Stockcharts.com's performance function, the best performing iindustries last week were the XLP's (consumer staples), up 2.47% and the XLV's (Health care) up 1.8%. The next best performing sector was the financial (XLF), up 1.23%. This was a technical bounce. I don't see this sector rallying with all of the problems they are having. The point here is traders are shifting assets to conservative market sectors.

In addition, the basic materials sector (XLB) and the energy sector (XLE) which were the best performing sectors over the last year have been losing value over the 90 day, 30 day, 10 day and weekly horizon. My guess here is traders are taking year end profits to lock in performance gains.

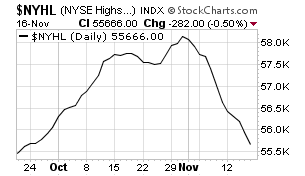
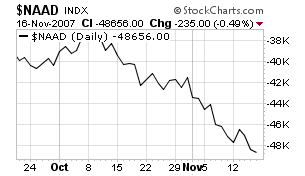
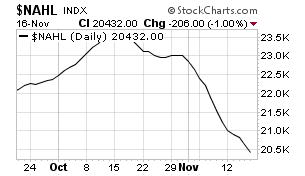
And market breadth continues to deteriorate across the board.

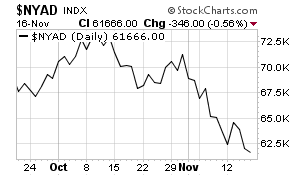
New York advance/decline line


New York new high/new low line


NASDAQ advance/decline line


NASDAQ new high/new low line


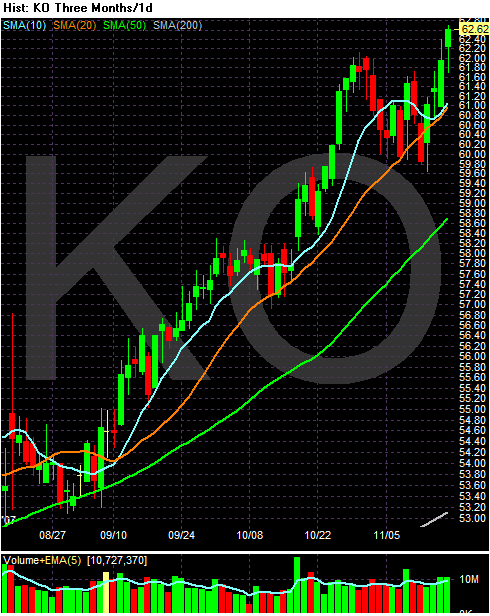
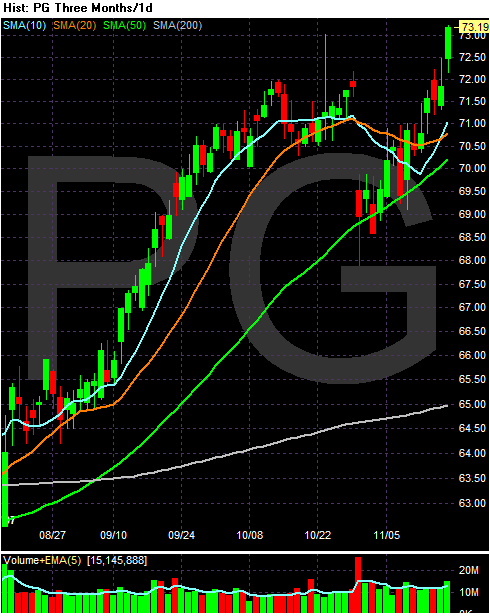
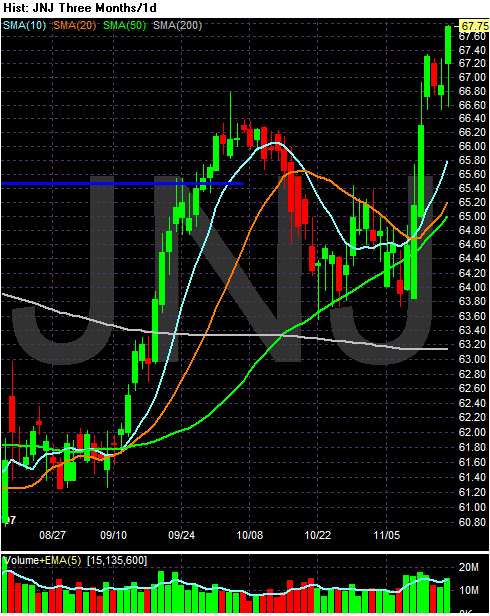
Notice the money flowing into conservative stocks

Coke


P&G


Johnson and Johnson


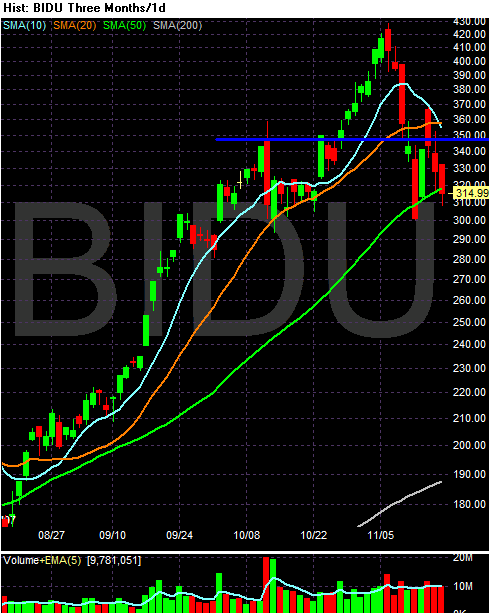
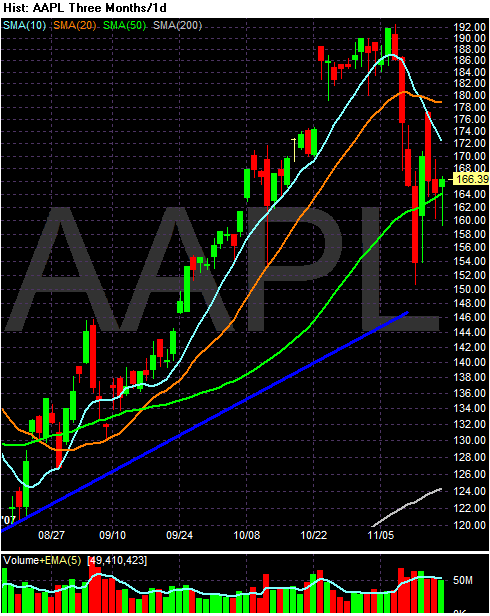
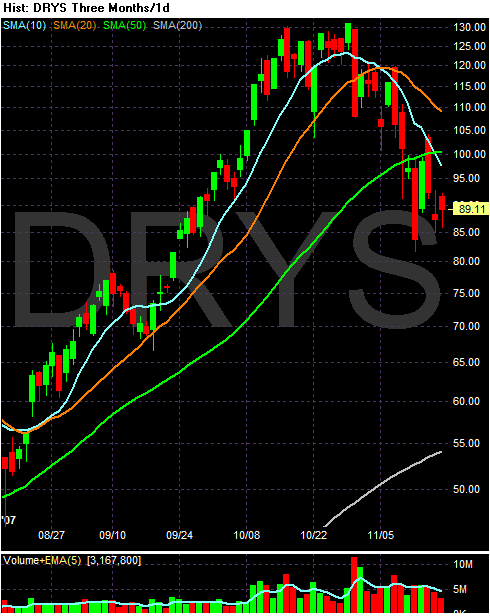
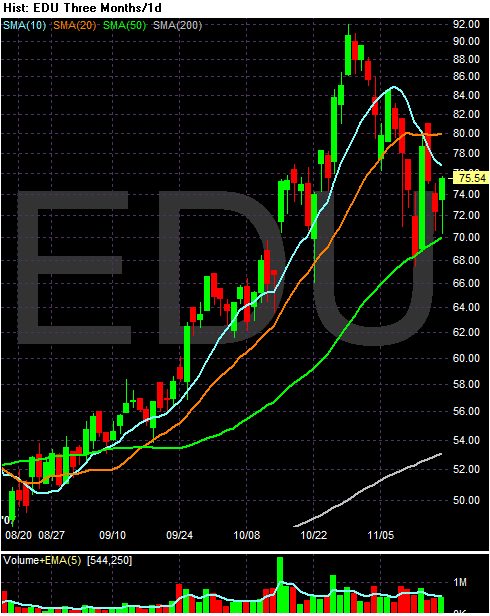
And notice how the high fliers are still consolidating below previous highs.

Bidu


Apple


Dry Ships


Edu

Saturday, November 17, 2007

The Longterm View of the Markets

Perspective in investing and trading is very important. Long-term charts (multi-year charts) provide much needed perspective about where markets are in the cycle. So here are some long term charts to give us some perspective on where the market is. I've kept the annotations on the charts to the bare minimum in the hope that this will help to make the trends easier to see.

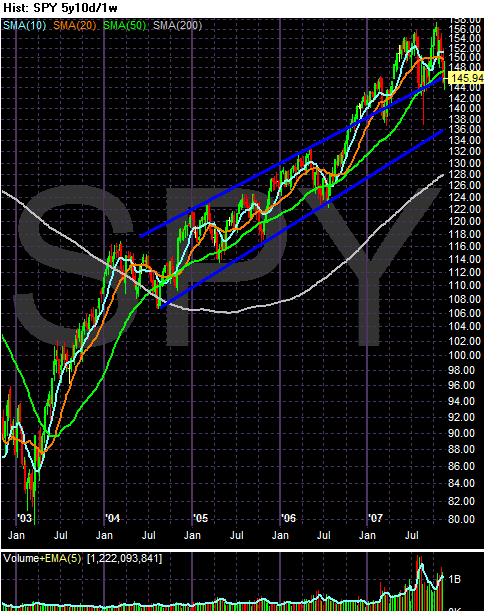
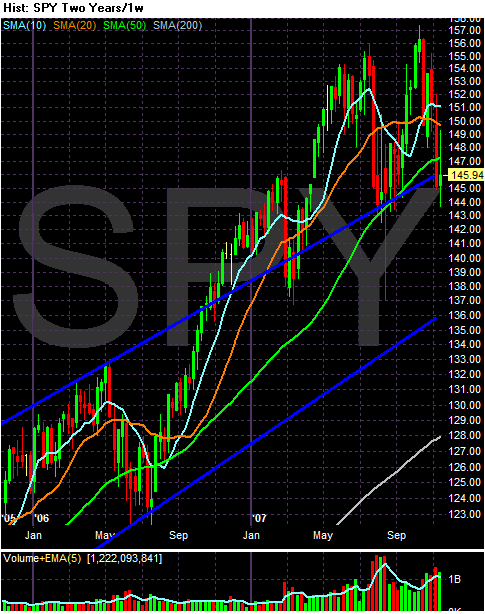
These are all weekly charts, meaning one candle equals one week of trading.


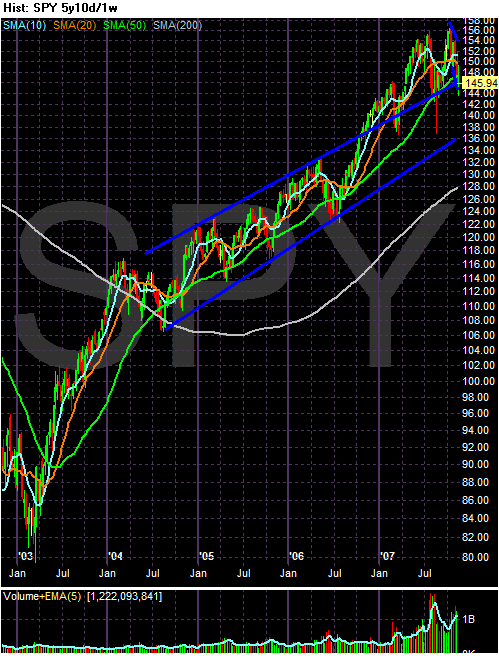
Starting in 2004, the SPYs started in an upward slanting channel. The markets broke out of this channel in late 2006. Three times since that break-out, the SPYs have used the upper channel line as support.


On the two year chart, notice we are right at the upper channel line. Also notice the market could drop from from the current upper channel line at about 145 to the lower channel line at about 136 and still be in the upward moving channel.


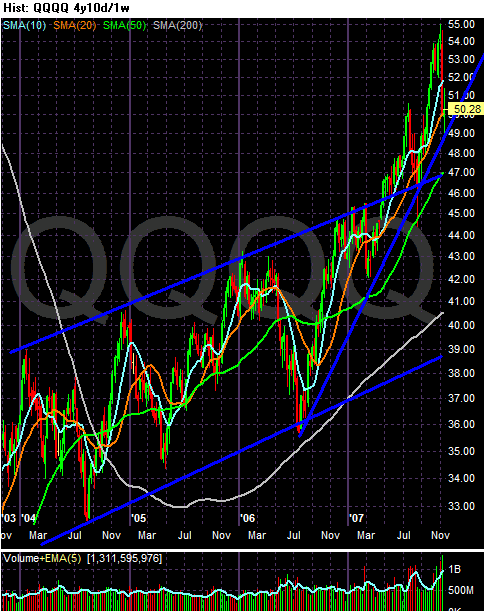
The four year QQQQ chart also shows the market was moving in an upward sloping channel until it broke out of that channel in May of tis year. Also note a second trend line that started a rally from the lower channel line in mid 2006.


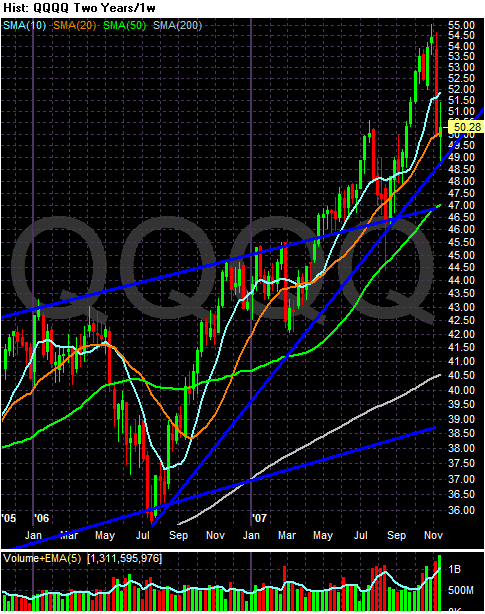
On the two year chart, notice we have a better look at the two primary uptrends. First, notice the QQQQs are still above the trend line that started in mid-2006. The market could drop another 3.5% (approximately) and still be in this uptrend. In addition, notice the QQQQs also have support from the upper channel line of the 4-year upward sloping channel. The markets would have to drop another 6% (approximately) to hit this trend line.


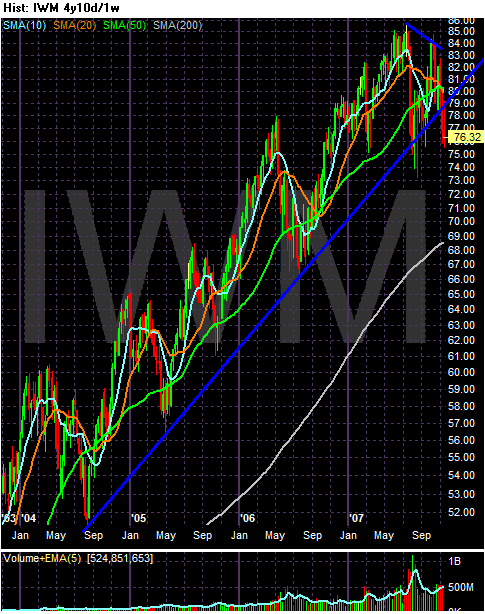
The four year Russell 2000 chart shows a solid four year trend in place.


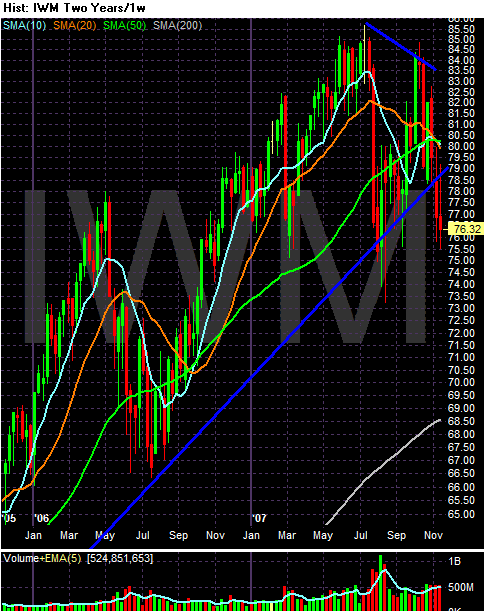
The two year Russell 2000 chart shows a we are below this trend line again. We've been here before earlier this year and bounced back.

So, what can we conclude?

1.) The SPY's are in good technical shape. There are two upward sloping trend lines that form a 4 year channel that will provide support for the index. This index has a long way to go before it breaks this trend.

2.) The QQQQs are also in good technical shape. They have two upward sloping trend lines and two upward sloping rallies in place.

3.) The Russell 2000 is below the trend line of a 4 year trend. This is technically dangerous and a further drop would indicate this average may be changing trend.

Weekend Weimar

This is usually the space where I put up a Weimar picture and tell you guys to go do something else -- anything except thing about the market. Well, that's what this is with one exception. The future Mr$. Bonddad is also a dog person and she has a Beagle named Scooby Do -- or as I call her, "the Scoober". So this week we'll be featuring a Beagle and a Weimaraner. The Weimar picture is from Steve Clemens over at the Washington Note.

So, go do anything except think about the markets or the economy. Have a good Saturday.


Friday, November 16, 2007

This Week's Markets

I'm going to do this one a bit backwards, but the daily charts are a bit more important in the discussion. So here goes ....


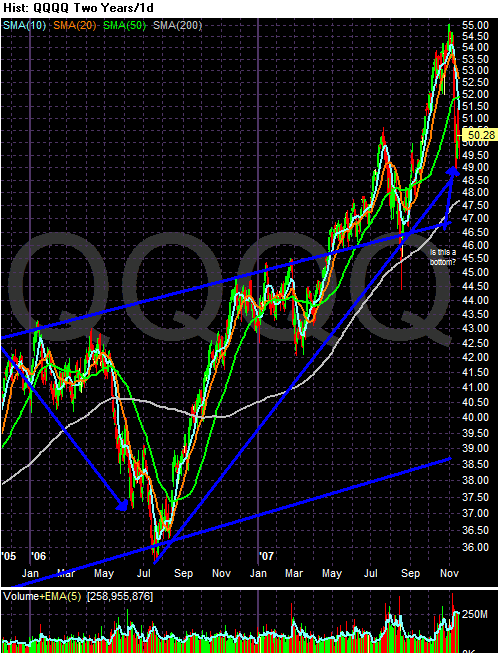
First, notice on the multi-year chart we're currency near a long-term trend line. Keep that in mind as we move through these charts.


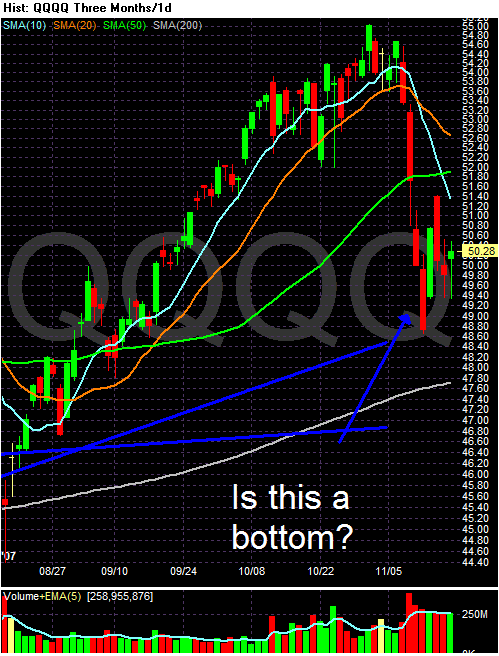
Are the QQQQs forming a bottom? That's the question we need to ask ourselves right now. The QQQQ's dropped hard at the end of last week, but have since been trying to find some kind of consolidation pattern. Remember the QQQQs were the market darling until a few weeks ago -- their lack of exposure to the mortgage mess was their saving grace. My guess is some traders are starting to nibble at cheaper shares based on the market's current position right above long-term support.


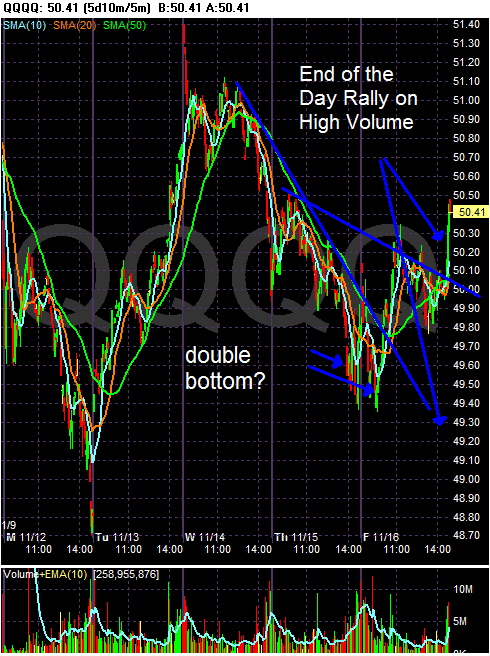
On the 5 day chart, notice the QQQQs dropped hard from Wednesday to the opening on Friday, but then formed a double bottom and rallied from there. Also notice the strong finish. We've gotten use to end-of-the-day sell-offs. Instead of that today we got a rally. This is a good sign because it indicates traders are willing to hold positions over the weekend -- a rather precarious proposition in the current economic environment.


The SPYs are currently at the upper trend line of a three year upward sloping channel. That's a technically important position.


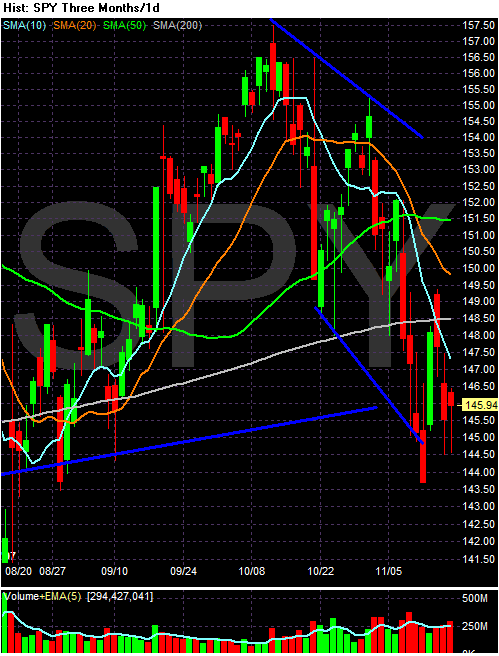
The SPYs daily chart indicates we are still looking for direction. The index is right below the 200 day SMA and the shorter SMAs are all pointing downward. But the upper trend line of the 3-year channel is acting as a center of gravity for prices right now.


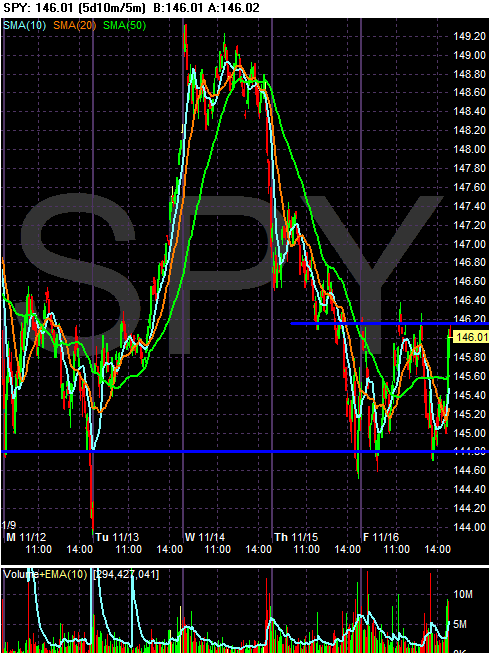
On the 5-day chart, notice we really didn't gain much ground this week. The index rallied, but couldn't hold the position. And while they too enjoyed an end-of the day rally, that rally didn't really push the index into technically meaningful territory; the index simply stayed in the day's overall range. All in all, a fair end but not great.

Why Transports Matter and What Inflation?

One company and two, two TWO grand themes!!!!

From the Street.com


FedEx (FDX - Cramer's Take - Stockpickr - Rating) lowered its earnings projection for the current quarter and fiscal year, citing increased fuel costs and weak freight trends.

The parcel-shipping giant now sees earnings of $1.45 to $1.55 for the quarter ending Nov. 30, down from its previous forecast of $1.60 to $1.75. Analysts polled by Thomson Financial anticipated earnings of $1.70 a share.

For the full fiscal year, FedEx projects earnings of $6.40 to $6.70 a share. Its prior view called for a profit of $6.70 to $7.10 a share; analysts had an average forecast for earnings of $6.85 a share.

FedEx had already offered weaker-than-expected projections for the periods in its first-quarter report in September. But the company said Friday that its fuel costs have increased 8%, or $85 million, since that time.


This is not the first time Fed Ex has recently warned about earnings. From September 20:

FedEx (FDX - Cramer's Take - Stockpickr - Rating) said earnings rose for the just-completed quarter, but the package carrier reduced its forecasts for the current quarter and the full year because of economic uncertainty.

The company encountered "a U.S. economy slowed by a sharp correction in the housing market, financial volatility and high energy costs," said CEO Fred Smith, on a conference call.

The impact was particularly severe at FedEx Freight, owing to the housing market's effect on the less-than-truckload transportation market,
he said. Still, strong international results led to profit growth.


Federal Express is the second largest company in the air services and freight sector. UPS is about twice as large. In other words, what Fed Ex say is very important for the overall economy. And what they are saying isn't very good.

Dow theory says the transports have to confirm the broader markets. The underlying logic is simple. If the economy is expanding, we'll have to ship more and more stuff. Conversely, if the economy is contracting, we'll be shipping less and less stuff. The logic is pretty much irrefutable.


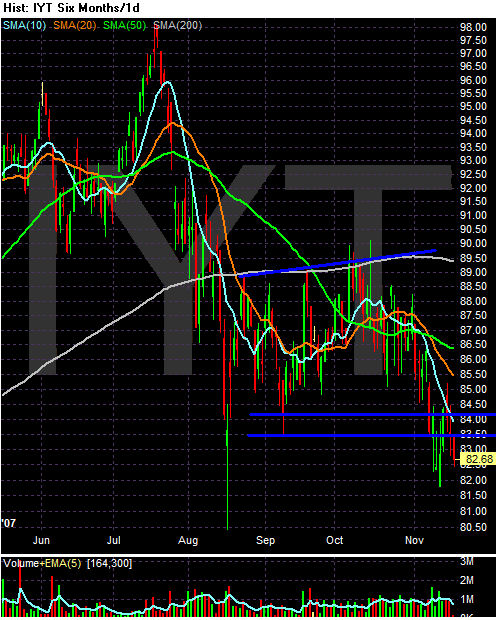
The transports say we're in trouble.

1.) The index is below the 200 day SMA, and has been there since early August.

2.) The shorter SMAs are below the longer SMAs.

3.) All of the shorter SMAs (10, 20 and 50) are moving lower.

4.) prices are below the SMAs.

Also note Fed Ex's statement about fuel costs. Fuel costs have increase 8% . That's a huge increase for a company that depends on oil costs.

S&P Earnings Down in the Third Quarter

From The Street.com

With the third-quarter earnings season nearing a close, the year-over-year profits for Standard & Poor's 500 companies declined 3%, according to Thomson Financial. The drop marks the first quarter in five years that American corporations have recorded an aggregate earnings decline. Thus far, 461 companies in the S&P 500 have reported earnings.

The last time investors experienced a negative quarter was in the first quarter of 2002, when the market logged an 11.5% decline.
Profit declines during the recession of 2001 included a third-quarter drop of 21.6% and a 21.5% drop in the fourth quarter.

"Profit declines portend recession if they lead to cutbacks in capital spending and labor," says John Lonski, chief economist at Moody's Investors Service. Lonski believes there is about a 40% chance of recession at this time, as the housing recession continues to spill over into the rest of the economy.


First, not all S&P companies have reported earnings, so its possible this overall earnings number could turn positive over the next few weeks.

Earnings are the mother's milk of stock market investors. Most valuation models are based (at least partially) on a price to earnings ratio, or PE. As earnings increased these models assume stock prices will increase as well because a company becomes more valuable. However, as earnings drop these models assume that stock prices will drop as well.

Hank Paulsen -- Comedian

From the WSJ:

Treasury Secretary Henry Paulson Friday said the U.S. continues to have a strong dollar policy and the value of the dollar will ultimately reflect strong U.S. economic fundamentals.

"We have very much a strong dollar policy; that's in our nation's interests," he said in a South African radio interview. "Our economy, like any other, has its ups and downs and its long-term strength will be reflected in our currency markets."
[Henry Paulson]

Mr. Paulson's comments echo those he made on Thursday and those of President Bush earlier in the week.


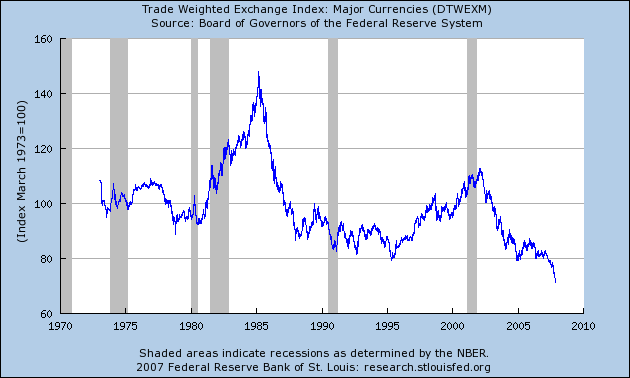
What is it with continually stating "we have a strong dollar policy"? For God's sake, will someone show these people a chart of the dollar? Here Hank -- take a look at this chart from the St. Louis Fed:


Anyone see a pattern here? Bueller? Bueller?

Bonddad's Engaged

Sorry for the lack of market update and posting. Last night I proposed to my girlfriend and she said yes. So there will be a Mr$. Bonddad. She is a wonderful woman very smart and pretty, who is also a very rational shopper.

I'm getting back up an running right now and will return to m blogging duties within a few hours.

Thursday, November 15, 2007

Has The Fed Ditched Core Inflation?

Hat Tip to Larry Kudlow on this one

From Bernanke's speech yesterday:

Ultimately, households and businesses care about the overall, or "headline," rate of inflation; therefore, the FOMC should refer to an overall inflation rate when evaluating whether the Committee has met its mandated objectives over the long run. For that reason, the Committee has decided to publish projections for overall inflation as well as core inflation. In its policy statements and elsewhere, the Committee makes frequent reference to core inflation because, in light of the volatility of food and energy prices, core inflation can be a useful short-run indicator of the underlying trend in inflation. However, at longer horizons, where monetary policy has the greatest control over inflation, the overall inflation rate is the appropriate gauge of whether inflation is at a rate consistent with the dual mandate.


While I'd like to take credit for this with all of my kvetching about "core inflation", I tend to think Ben doesn't read my a whole lot.

There is a bit of confusion about when the Fed would use core and headline inflation -- as in what is the difference between long and short run.

It also leads to a very interesting question. The chart a few posts below shows the year over year headlines inflation number is clearly increasing. Does that mean the Fed will now start raising rates in response to that long-term trend?

Retailers Facing Tougher Christmas Season

From Marketwatch:

J.C. Penney Co. reported Thursday a 9.1% drop in third-quarter profit, hurt by sweeping discounts to clear unsold merchandise, as the department-store operator cut forecasts for the fourth quarter and the full year, citing macroeconomic concerns.

It marked another ominous sign for the retail sector's prospects as the holiday gift-giving season -- the biggest selling period for retailers -- approaches. Discounts and promotions are expected to be the theme this year, receipts for which were recently forecast by an industry group as likely to be the worst seen in five years.

.....

"We have to be realistic about our expectations for the balance of the year," he said, adding that "2008 is going to continue to be a difficult environment. We are planning 2008 very conservatively on expenses."

Retailers last week reported their worst October results in a decade, hurt by weather and consumers' jitters about the economy.


The reason?

Retail sales data released Nov. 14 by the U.S. Commerce Dept. show total retail sales increased a mere 0.2% from last month as consumers refrained from purchasing furniture, sporting goods, and general merchandise. "Gas prices and other economic issues are beginning to have an effect on consumer spending," says Rosalind Wells, chief economist at the National Retail Foundation.

AAA's Daily Fuel Gauge Report shows that motorists nationwide paid an average of $3.11 per gallon of gasoline on Nov. 14, up from $2.75 a gallon a month ago. Guy Caruso, head of the Energy Information Administration, an arm of the U.S. Energy Dept., warned that gasoline prices, while high, don't yet fully reflect the price of crude oil, which is trading around $94 per barrel. On Monday, the U.S. Energy Dept. warned prices could rise another 20¢ a gallon over the next two to three weeks if refiners pass along the increase in crude oil prices.


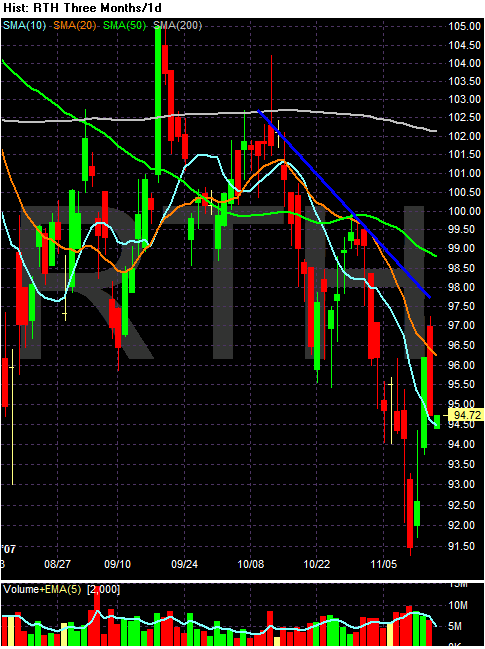
Traders are responding accordingly. First, here is a chart of the retail ETF:


Notice it has been in a clear downtrend since the beginning of October.


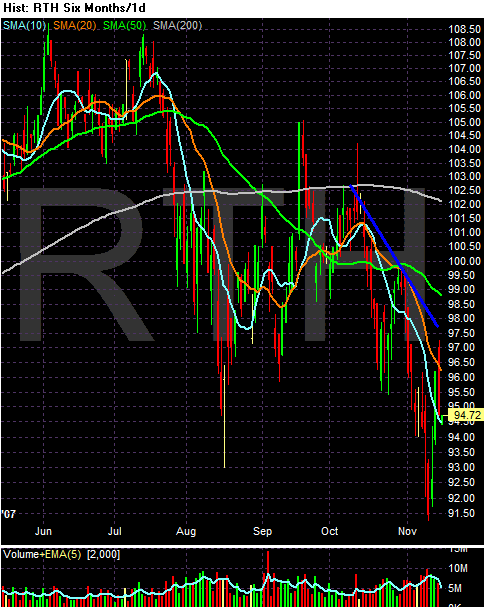
On the 6 month chart, notice

1.) The average is below the 200 day SMA -- bear market territory

2.) The 10, 20 and 50 day SMAs are all moving lower.

3.) The shorter SMAs are below the longer SMAs

This chart is very bearish.

Everything You Need To Know About CPI

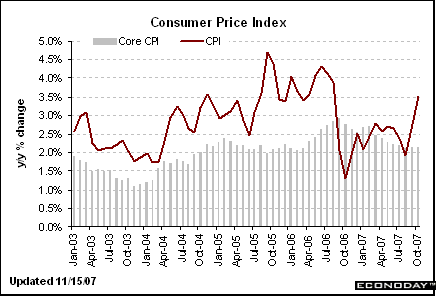
The year over year percentage change from Econoday:


Non inflation here. None at all.

One of the main issues going forward is what the Fed can and will do about interest rates. This y/y increase leads me to conclude the Fed is getting backed into more and more of a corner about future interest rate cuts. I could be wrong, however, because I think energy and food prices count.

CPI Up .3%

From the BLS:

During the first ten months of 2007, the CPI-U rose at a 3.6 percent seasonally adjusted annual rate (SAAR). This compares with an increase of 2.5 percent for all of 2006. The index for energy, which increased 2.9 percent in 2006, advanced at a 12.3 percent SAAR in the first ten months of 2007. Petroleum-based energy costs increased at a 20.6 percent annual rate and charges for energy services rose at a 2.7 percent annual rate. The food index has increased at a 5.5 percent rate thus far in 2007, following a 2.1 percent rise for all of 2006. Excluding food and energy, the CPI-U advanced at a 2.3 percent SAAR in the first ten months of 2007 after increasing 2.6 percent in 2006.


The 10 month figures do not look good. But then again, the headline number is all people look at anyway. And here's how the Federal Reserve Will Look at the release:

During the first ten months of 2007, the CPI-U rose at a 3.6 percent seasonally adjusted annual rate (SAAR). This compares with an increase of 2.5 percent for all of 2006. The index for energy, which increased 2.9 percent in 2006, advanced at a 12.3 percent SAAR in the first ten months of 2007. Petroleum-based energy costs increased at a 20.6 percent annual rate and charges for energy services rose at a 2.7 percent annual rate. The food index has increased at a 5.5 percent rate thus far in 2007, following a 2.1 percent rise for all of 2006. Excluding food and energy, the CPI-U advanced at a 2.3 percent SAAR in the first ten months of 2007 after increasing 2.6 percent in 2006.

This is What A Real Central Bank Looks Like

Barry over at the Big Picture blog calls the US method of dealing with inflation as "inflation ex-inflation." What he's getting at is simple: simply remove the price increases (the inflationary price increases) from your model and you don't have inflation.

I will be the first to admit that the US Fed is in an incredibly difficult place. However, I believe they have erred on the wrong side by lowering interest rates for several reasons.

1.) Interest rates aren't that high right now. For people to think that 4.5% for Fed Funds is high is simply ridicules. It's a cheap. And the 10-year Treasury is currently yielding 4.26% -- hardly excessive by any measure. In other words, the central issue isn't the cost of money, it's confidence in financial intermediaries. Lenders are concerned that borrowers won't be around long enough to repay a loan. There is nothing that interest rate policy can do about that.

2.) Inflation is a huge issue. My first reason for thinking this is personal experience. I shop every 4-5 days. Over the last year or so I have seen my prices paid increase at high rates. A gallon of milk -- which had been around $3 for the longest of times -- has increased to $4 over the last year. The packages of chicken I purchase have increased from $4-$5 to $7-$8 over the last year. Yet at the same time I am reading headlines that core inflation is "tame". Simply put, that headline has made less and less sense over the last half year or so.

But there are other less personal reasons for thinking the "core" inflation policy is stupid. First, the Fed is the only central bank that uses core inflation as its inflation figure. That alone should raise eyebrows. But also consider that oil prices alone have increased 400% over the last 6 years. The latest CPI report stated food prices increased at a 5.7% seasonally adjusted annual rate in 2007. Just go to this link and start looking through the various long-term (multi-year) charts and you'll see that commodity prices have been accelerating for the last years at very high rates. Also see the first part of this article at Financial Sense Online. Basically, I'm have a harder and harder time seeing commodity price charts that have massive long-term price increases and believing all is well on the core front.

And while I am not formally endorsing him, this statement by Ron Paul to Ben Bernanke at a recent Congressional hearing was a breath of fresh air:


Ron Paul to Bernanke: The bubble has been burst. We saw what happened after the NASDAQ bubble burst. We don’t ask how it was created. And then we a housing bubble and it’s deflating and it’s spreading. And yet, nobody says, “Where does it come from?” And what is the advice that you generally get, and that is, ---inflate the currency. They don’t say, ---“Inflate the currency.” They don’t say, --- “Debase the currency.” They don’t say, --- “Devalue the currency.” They don’t say, “Cheat the people who have saved.” They say, “Lower the interest rates.” But they never ask you, and I don’t hear you say too often, “The only way I can lower interest rates, is I have to create more money. I have to lower the discount rate. I have to make it generous. I have to increase reserves. I have to lower the interest rates and fix the interest rates, over-night rates.” The only way you can do this, is by increasing the money supply. I see this as the problem that we don’t want to talk about.


In contrast, the European Central Bank is treating this with the importance it deserves:

The European Central Bank will monitor "very closely" all developments and stands ready to act on interest rates should risks to price stability start materializing, the ECB said in its November Monthly Bulletin released Thursday.

There are upside risks to the central bank's inflation outlook, as money and credit growth remains vigorous, and "monetary policy stands ready" to counter those risks, the ECB said. It stressed that it will act "in a firm and timely manner" to meet the inflation mandate, namely to anchor inflation at just below 2% over the medium term.

Financial market participants are likely to see this as a confirmation that the ECB hasn't abandoned the idea of an interest-rate increase, despite recent rate cuts by the U.S. Federal Reserve.


The point of this rather long-winded diatribe is simple. The European Central Bank has the right policy and the US doesn't. In addition, the US economy is built on easy credit and has been for the last 20 years. The only way we know how to get out of a problem is to lower rates. I have to wonder whether easy credit will still be the answer for the current problems. And more importantly, I am deeply concerned the cure is worse than the disease.
Wednesday, November 14, 2007

Keep a close eye on the Russell 2000

From Investopedia

An index measuring the performance of the 2,000 smallest companies in the Russell 3000 Index, which is made up of 3,000 of the biggest U.S. stocks. The Russell 2000 serves as a benchmark for small-cap stocks in the United States.


Small cap stocks are about growth as opposed to dividends. As such, the small cap index needs a healthy economy; in order for a company that needs to grow the environment the company is operating in much be growing as well. In addition, because these are smaller stocks they are considered riskier. So watching this index can give us an idea of investors risk appetite.
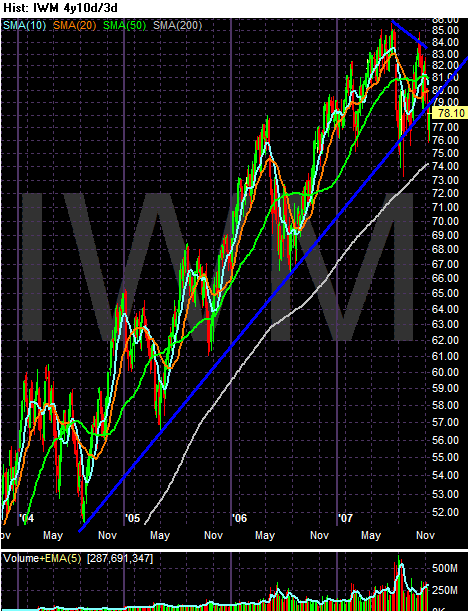
Here is a four year chart of the Russell 2000


Notice the Russell is in the middle of a 4 year rally. However,


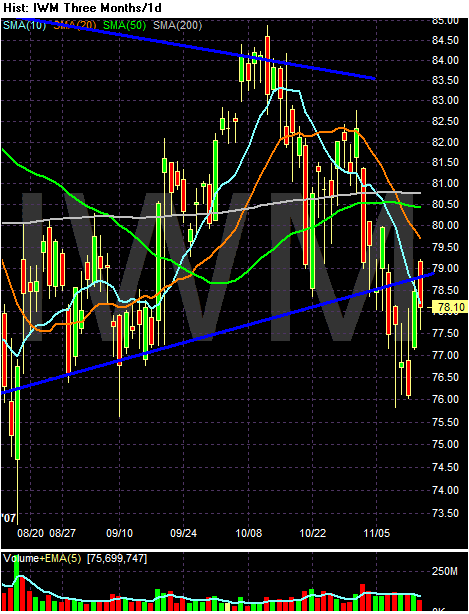
Notice on the 3 month chart prices are now below that 4 year trend line. They've dipped down to this level before a few months ago and bounced back. But whenever an index in the middle of a 4 year bull market is near the lower trend line it's important to keep a very close eye on what it's doing.

Today's Markets


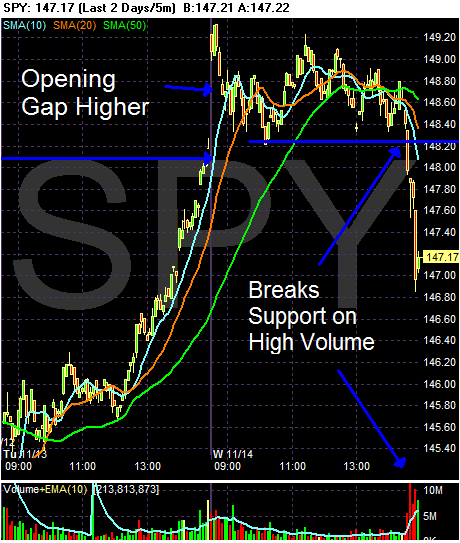
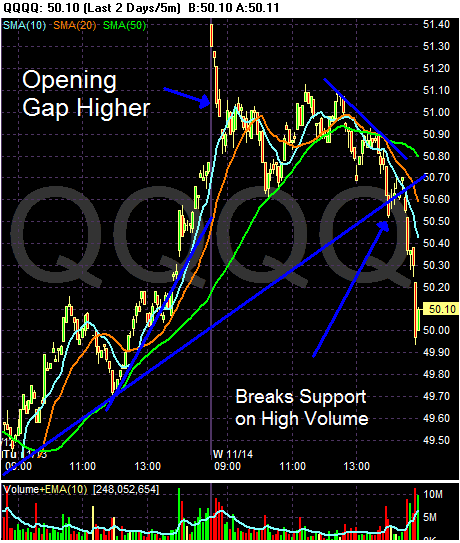
Both the SPYs and the QQQQs gapped higher at the open. Then both sold off to their respective support levels. Once they hit those levels, the selling started in earnest on higher volume. Once again, we have an end-of-the day sell-off on big volume. My guess is traders are concerned about the CPI report tomorrow. A number high enough to imply the Fed can't lower rates anymore will probably be trouble for the markets.


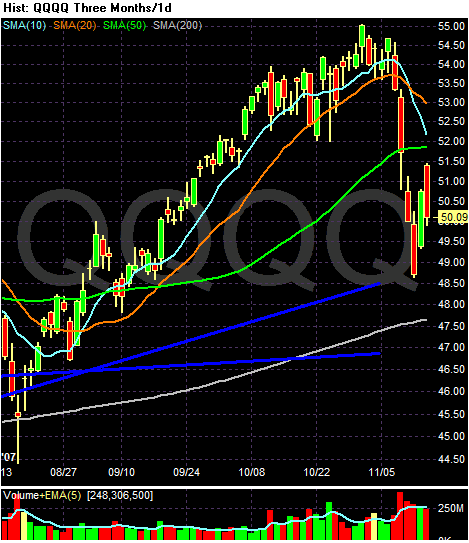
With the QQQQs, I'm beginning to wonder if we're going to see a dead-cat bounce. This occurs when prices drop hard, rebound a bit and then drop back to levels from the hard sell-off. On this chart, prices would go back to the $48.60 level. A hard sell-off indicates a rapid reverse in overall psychology along with underlying concern about something. Traders may not know exactly what they are concerned about, but something has them spooked enough to get out quickly.


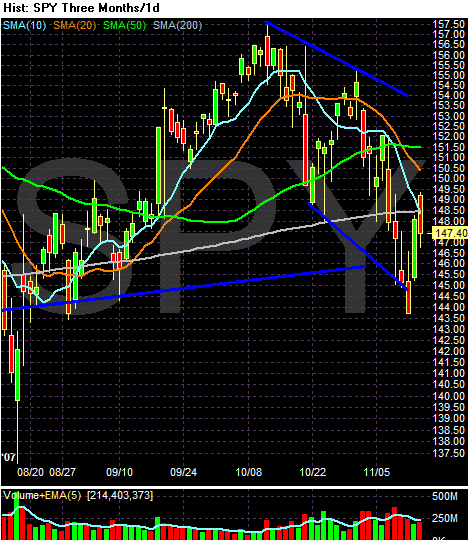
With the SPYs, notice we're still clearly in a downward sloping range, coming down from a peak in early/mid October. Prices have crossed the 200 day SMA -- a good sign -- but they have printed a bearish bar. Also note the 10 and 20 day SMAs are headed lower.

And the Hits Just Keep On Coming

From Business Week:

AAA's Daily Fuel Gauge Report shows that motorists nationwide paid an average of $3.11 per gallon of gasoline on Nov. 14, up from $2.75 a gallon a month ago. Guy Caruso, head of the Energy Information Administration, an arm of the U.S. Energy Dept., warned that gasoline prices, while high, don't yet fully reflect the price of crude oil, which is trading around $94 per barrel. On Monday, the U.S. Energy Dept. warned prices could rise another 20¢ a gallon over the next two to three weeks if refiners pass along the increase in crude oil prices.


Isn't that just wonderful news.

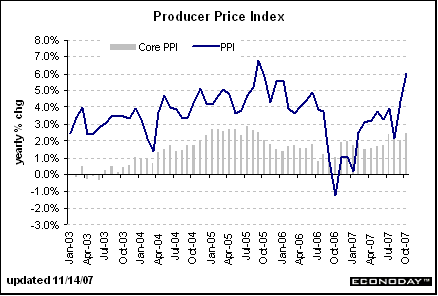
The Only Thing You Need to Know About PPI

From Econoday -- the yearly percentage change in PPI.


I don't see any inflation -- or any kind of inflationary trend. Do you?

Follow That Lemming.....Redux

From CNBC:

Bear Stearns expects to write down $1.2 billion of assets linked to mortgages in the fourth quarter, but the worst of the bank's mortgage writedowns is over, Bear's chief financial officer said.


Right. And we can win a land war in Asia....

Follow That Lemming.....

From Bloomberg:

Goldman Sachs Chief Executive Officer Lloyd Blankfein told a New York conference yesterday that the largest U.S. securities firm by market value doesn't plan ``significant'' writedowns from subprime-mortgage securities. Bank of America said its losses will be restricted to $3 billion next quarter and UBS AG analyst Glenn Schorr said the potential for losses at Lehman Brothers Holdings Inc. is ``negligible.''


From the latest IMF report


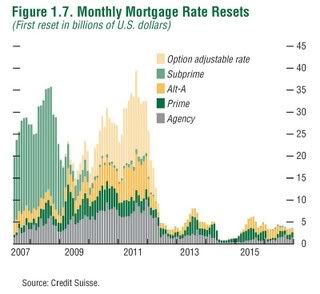
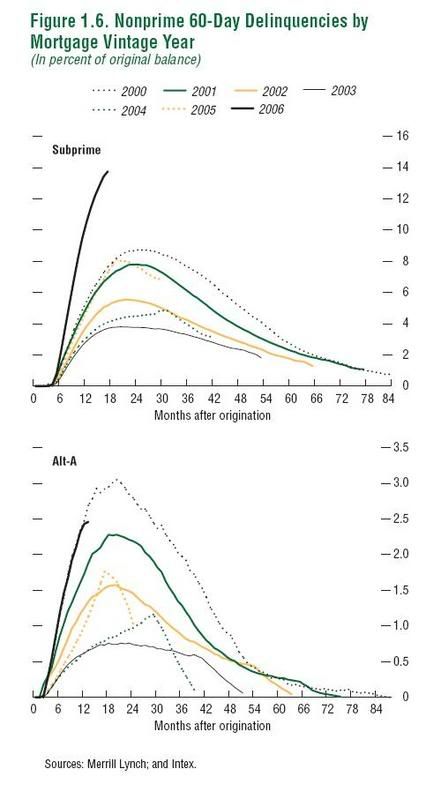
I could be wrong and all of the problems in the financial sector could be front loaded. But with three years of resets out there (chart 1) and increasing delinquencies that undermine the underlying assumptions of most CDO structures (chart 2), I have a hard time believing that.

Your Daily Loan Loss Increase Post

From Bloomberg:

HSBC Holdings Plc, Europe's biggest bank by market value, said emerging-market lending lifted third- quarter profit, offsetting losses in U.S. mortgages that are spreading to credit-card and unsecured loans.

Shares of the London-based bank rose 3.7 percent after HSBC said in a trading statement that its securities unit has ``very little direct exposure to U.S. subprime mortgage-backed collateralized debt obligations.'' HSBC set aside $3.4 billion to cover U.S. defaults, $1.4 billion more than it forecast in July.

``Given that they have increased provisions by more than $1 billion, for them to say pretax profit in the third quarter is ahead is little short of amazing,'' said Alex Potter, a London- based analyst at Collins Stewart Plc who rates the shares ``buy.''

HSBC's consumer lending in the Middle East, Hong Kong and China are ``strongly ahead'' of last year, the bank said without providing specifics. That's helping Chairman Stephen Green counter a ``broader deterioration'' in U.S. housing and credit markets than he forecast four months ago. The bank said it will take a $55 million charge to close an additional 260 consumer finance branches in the U.S.


Let's look at the numbers here. According to the article, HSBC estimated their loan loss provision at $2 billion in July. Three months later, that increases by $1.4 billion -- that's a 70% increase in three months. Something really changed in three months regarding their estimates of the US market -- and none of the underlying reasons for that change are good. Either HSBC underestimated their loan loss in July (highly unlikely), or something fundamentally changed in the market over the last three months.

But right now it's time to bottom fish in the financial sector? Please.