Thursday, February 27, 2020

Yes, coronavirus is roiling the markets


 - by New Deal democrat
Back in the day, I used to tease Bonddad whenever he did a “What in the hell happened in the stock market today?” posts. I figured it was a sure sign of a short term bottom.
I’m at risk for the same sort of thing here, so, first of all ... I have no clue what will happen tomorrow. The DJIA could bounce back 1000 points for all I know. When sentiment gets extreme and there are emotional moves, some wolves step in to make a killing.
In any event, there were probably three important reasons for today’s 4% selloff, on top of the declines earlier in the week.
In reverse order of importance, they were:
3. The first apparent community transmission of coronavirus in California. This suggests that containment may already have failed, and coronavirus is spreading to non-target groups in the US. Put another way, that this was just the tip of the tip of the iceberg that is, to mix metaphors, dead ahead.
2. A vote of no-confidence in Trump’s press conference last night. Wall Streeters may, by and large, be right-wingers, but they’re not stupid. And what they saw was that Trump is treating this as a re-election issue. He has put his partisans in charge of the response, and is muzzling the government scientists. In short, he is not taking the steps necessary (like ordering thousands of test kits, I dunno, a week ago) to in any way contain the virus.
1. A realization that corporate profits are going to be strongly negatively affected. The stock market trades on “forward profits,” in other words, what they anticipate profits will be in the quarters just ahead.
Here’s what the estimates for the quarters ahead looked like one month ago:
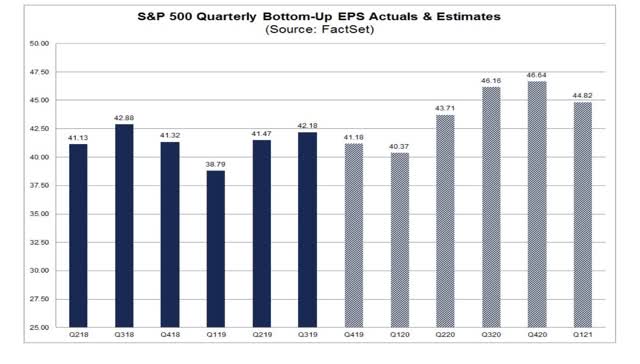
Here is what they looked like last week:
Notice that they were revised down somewhat - but that is typical. Once the Quarter at issue hits, usually a majority of companies are able to “beat” these estimates.
But what has been happening this week is a re-evaluation of what corporate profits in the next few quarters are likely to be. I don’t have the link at hand, but a major Wall Street bank came out this morning and said that they now anticipate *NO* profit growth whatsoever this year. That, dear readers, is a major downward re-evaluation. And the cold-blooded sharks on Wall Street are adjusting their portfolios accordingly. 

January durable goods orders show no important weakening


 - by New Deal democrat

Just to update: neither initial jobless claims nor continuing claims met either of my thresholds for concern this week. Both are below their levels a year ago, and the four week average of initial claims is less than 5% above its lows for this expansion.

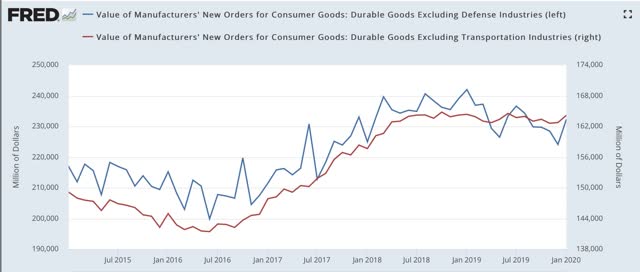
Ordinarily I don’t pay too much attention to durable goods orders, because they are too volatile, but because consumer durable goods orders are an important marker for how well the consumer is holding up, they are particularly worth a look now.

Here the news for January was positive, as both non-transportation and total consumer durable goods orders improved slightly:


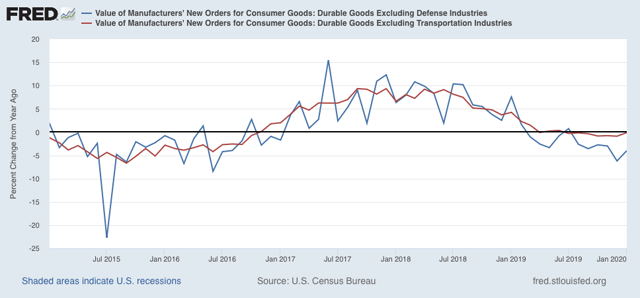
The former is flat YoY, while total orders are down, but no moreso than during 2015-16:


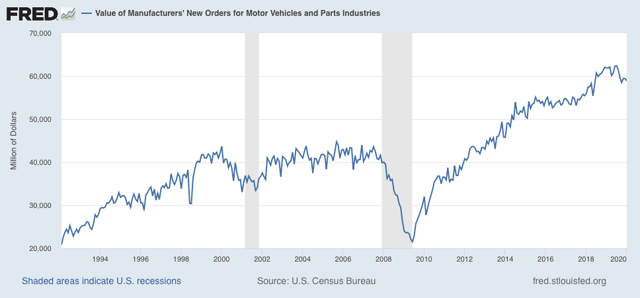
One important soft spot, however, is motor vehicle orders:


But these aren’t down as much as they were before the 2001 producer-led recession.

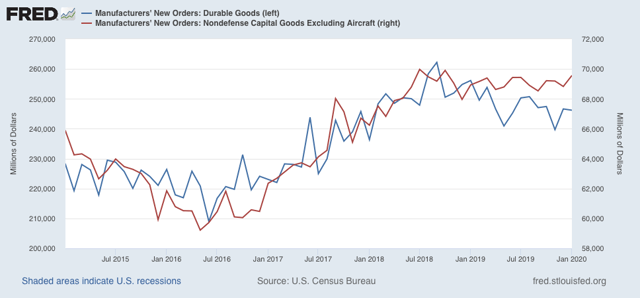
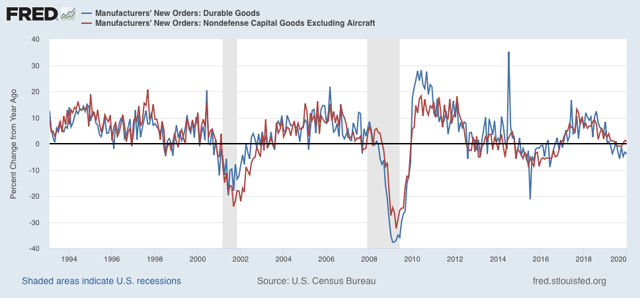
Broadening out from consumers, total manufacturers’ new orders declined slightly, while “core” manufacturer’s new orders improved:


Because the latter excludes Boeing, which is having unique problems now, I think the former is more important at this point. Again, we aren’t down as much YoY as we were right before the 2001 producer-led recession:


Bottom line: no worsening in January, except for the important motor vehicle industry.

Wednesday, February 26, 2020

The impact of coronavirus on my slowdown vs. recession forecast


 - by New Deal democrat

For roughly the last half year, my forecast has been that a slowdown without a recession was the most likely scenario, *IF* the economy were left to its own devices.

Well, given the horror scenarios possible with the coronavirus outbreak, the economy is certainly not being “left to its own devices.”

I took a look at how that intersects with my forecast over at Seeking Alpha.

As usual, clicking over and reading should be helpful to you, and rewards me a little bit for my work.

New home sales complete data confirming rebound


 - by New Deal democrat

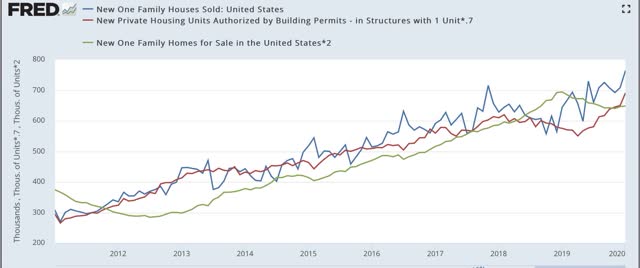
This morning’s new single home sales report for January came in at the highest level since July 2007.    As a brief reminder, this series is probably the most leading of all housing data, but it is extremely volatile and heavily revised, so as always take this initial number with a grain of salt.

In any event, here is a graph covering the last nine years since the bottom, showing sales (blue), single family permits (red, *.7 for scale), and inventory of new homes for sale (green, *2 for scale):


Both permits and sales are at new expansion highs. The difference is that permits are *much* less volatile. Note that inventory, as always, is lagging, being slightly above its bottom this past November.

I’ll have a much more extensive look up at Seeking Alpha later, and will link to it here. For now, the takeaway is that, except for the very real concern about coronavirus, housing strength would completely negative a recession in the near future.

Tuesday, February 25, 2020

Housing: prices follow sales, February 2020 edition


 - by New Deal democrat

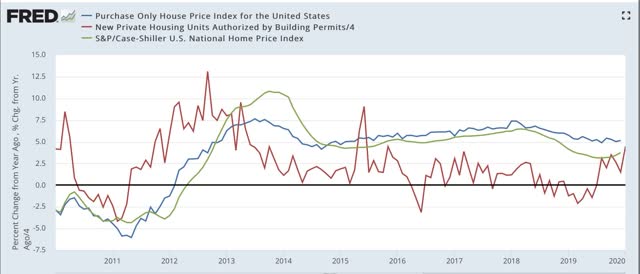
One of the consistent things I have written about the housing market for going on 10 years is that interest rates lead sales, and sales in turn lead prices. Last week with the continued increase in housing starts and permits we got further proof of the former, and this morning with the release of several house price indexes, we got further proof of the latter.

Below I show the FHFA house price index (blue), Case Shiller national house price index (green), and housing permits (red, /4 for scale). Because prices are seasonal, I show all of these metrics YoY:


The trough for permits YoY was last March. The trough for both the FHFA and the Case Shiller indexes was last August. The YoY change increased m/m for the FHFA from 4.9% to 5.1% in December. For the Case Shiller national index the YoY rate of change increased from 3.5% to 3.8%.

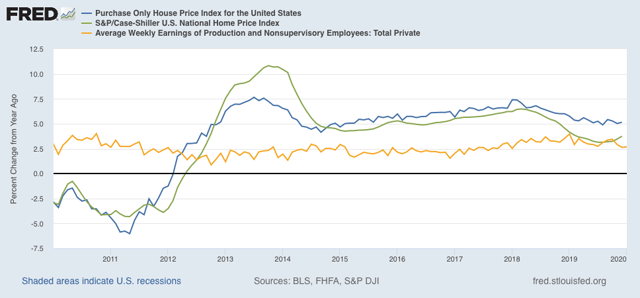
Although median household income is the best measure, since it is not available m/m from government sources, as a proxy the below compares average weekly earnings for non-supervisory households (gold) with both the FHFA and Case Shiller indexes:


Earnings have not kept pace with house price increases. What is undergirding the upswing in housing sales is the steep decline in interest rates since the end of 2018.

Monday, February 24, 2020

An updated look at transportation


 - by New Deal democrat

Production of goods and their transport to market should generally move in unison. A month ago I took an extended look at why most analyses of transportation were too bearish. This is of heightened interest because the coincident data on production, sales, and income are all so close to recessionary levels.

Well, we have another month of data, so it’s time for an updated look. This post is up at Seeking Alpha. As usual, clicking over and reading puts a penny or two in my pocket.

Sunday, February 23, 2020

Live-blogging the Fifteenth Amendment: February 22, 1869


 - by New Deal democrat

On February 22, the Senate took up the revisions that the House of Representatives had made to their proposals from one week prior. The House had struck from the Senate’s version, as sent to the House, the section extending the protections of the Amendment to qualifications for office, as well as the companion Amendment reforming the Electoral College.

Senator Stewart (Republican from Nevada) proposed that the Senate disagree with the House and send back the following version:

The right of citizens of the United States to vote and hold office shall not be denied or abridged by any State on account of race, color, nativity, property, creed, or previous condition of servitude. 
The Congress by appropriate legislation may enforce the provisions of this article.

Stewart moved that the Senate ask for a conference committee to iron out their differences. There was dismay that the House was insisting on having its exact way as to this amendment, as had been the case for the past number of years as to all legislation, and that the attempt to reconcile their differences might be futile. 

The Senate decided to put off voting on the proposal for a day. 

Source: Congressional Globe, 40th Congress, 3rd Session, pp. 1440-42.

Saturday, February 22, 2020

Weekly Indicators for February 17 - 21 at Seeking Alpha


 - by New Deal democrat

My Weekly Indicators post is up at Seeking Alpha.

Aside from the sudden improvement in new manufacturing orders I wrote about earlier this week, the significant changes have moved from the short leading forecast to the coincident nowcast.

Clicking through and reading will give you the reason I say that, and as usual reward me a little bit for my efforts.

Friday, February 21, 2020

Production, transportation, and sales show a stalled economy


 - by New Deal democrat

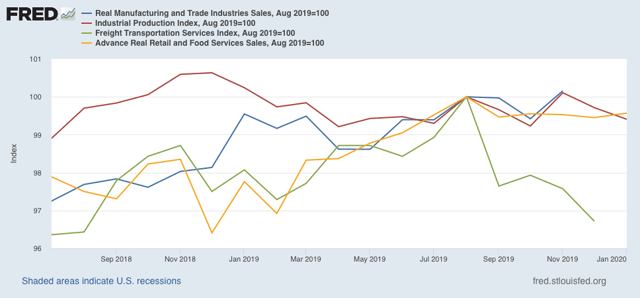
Below is a graph I put together in a discussion of transportation that I’ll probably post next week at Seeking Alpha.

The idea behind the graph is that (1) everything that is produced needs to be transported to market; i.e., the two metrics should move essentially in tandem (this is known as the “Dow theory” in financial markets); and (2) sales also ought to reflect - and slightly lead - what is being transported to market, since production is geared to match anticipated sales.

Anyway, here it is:


The blue and gold lines are two measures of sales. The green line is retail, the blue also adds manufacturing and wholesale sales to retail. Both are inflation-adjusted. The red and green lines are production and transportation, respectively. All are normed to 100 as of last August.

What we see is that production, transportation, and sales are all either flat or down since then. Although I didn’t include it, real personal income is only up +0.2% since then. Only jobs continue to show significant growth.

In short, since 6 months ago the economy has been in a very real slowdown, and in many respects has stalled.

Note that this is a nowcast, not a forecast, so you shouldn’t project this forward. But given how badly coronavirus is affecting China’s output, if the economy otherwise remains weak for the next several months, that might be enough to tip it into contraction.


Thursday, February 20, 2020

Housing analysis at Seeking Alpha; updated jobless claims


 - by New Deal democrat

I have a more detailed analysis of yesterday’s very positive housing permits and starts data, and what it means for the economy for the rest of this year, over at Seeking Alpha.  As usual, clicking over and reading helps reward me a little bit for my efforts.

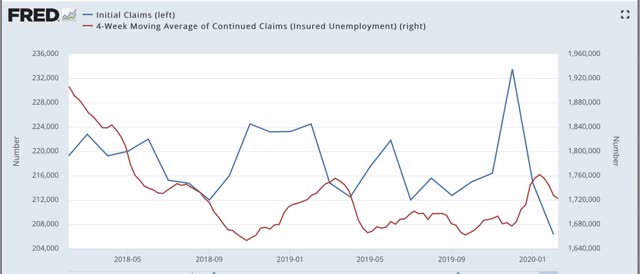
This morning’s weekly jobless claims report continues the recent string of very positive numbers. Here’s the updated graph of the monthly average of initial claims, plus the 4 week average of continuing claims:


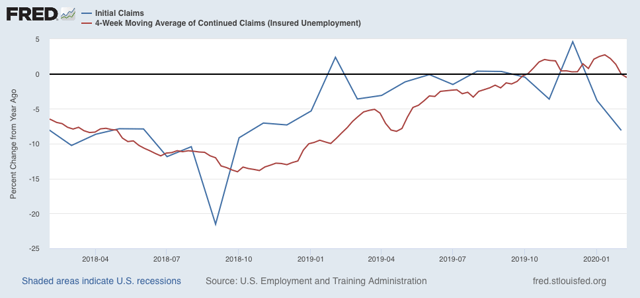
And here is the same information graphed YoY:


There isn’t going to be a recession so long as jobless claims stay close to their lowest levels and are lower YoY.

Wednesday, February 19, 2020

Housing continues to surge


 - by New Deal democrat

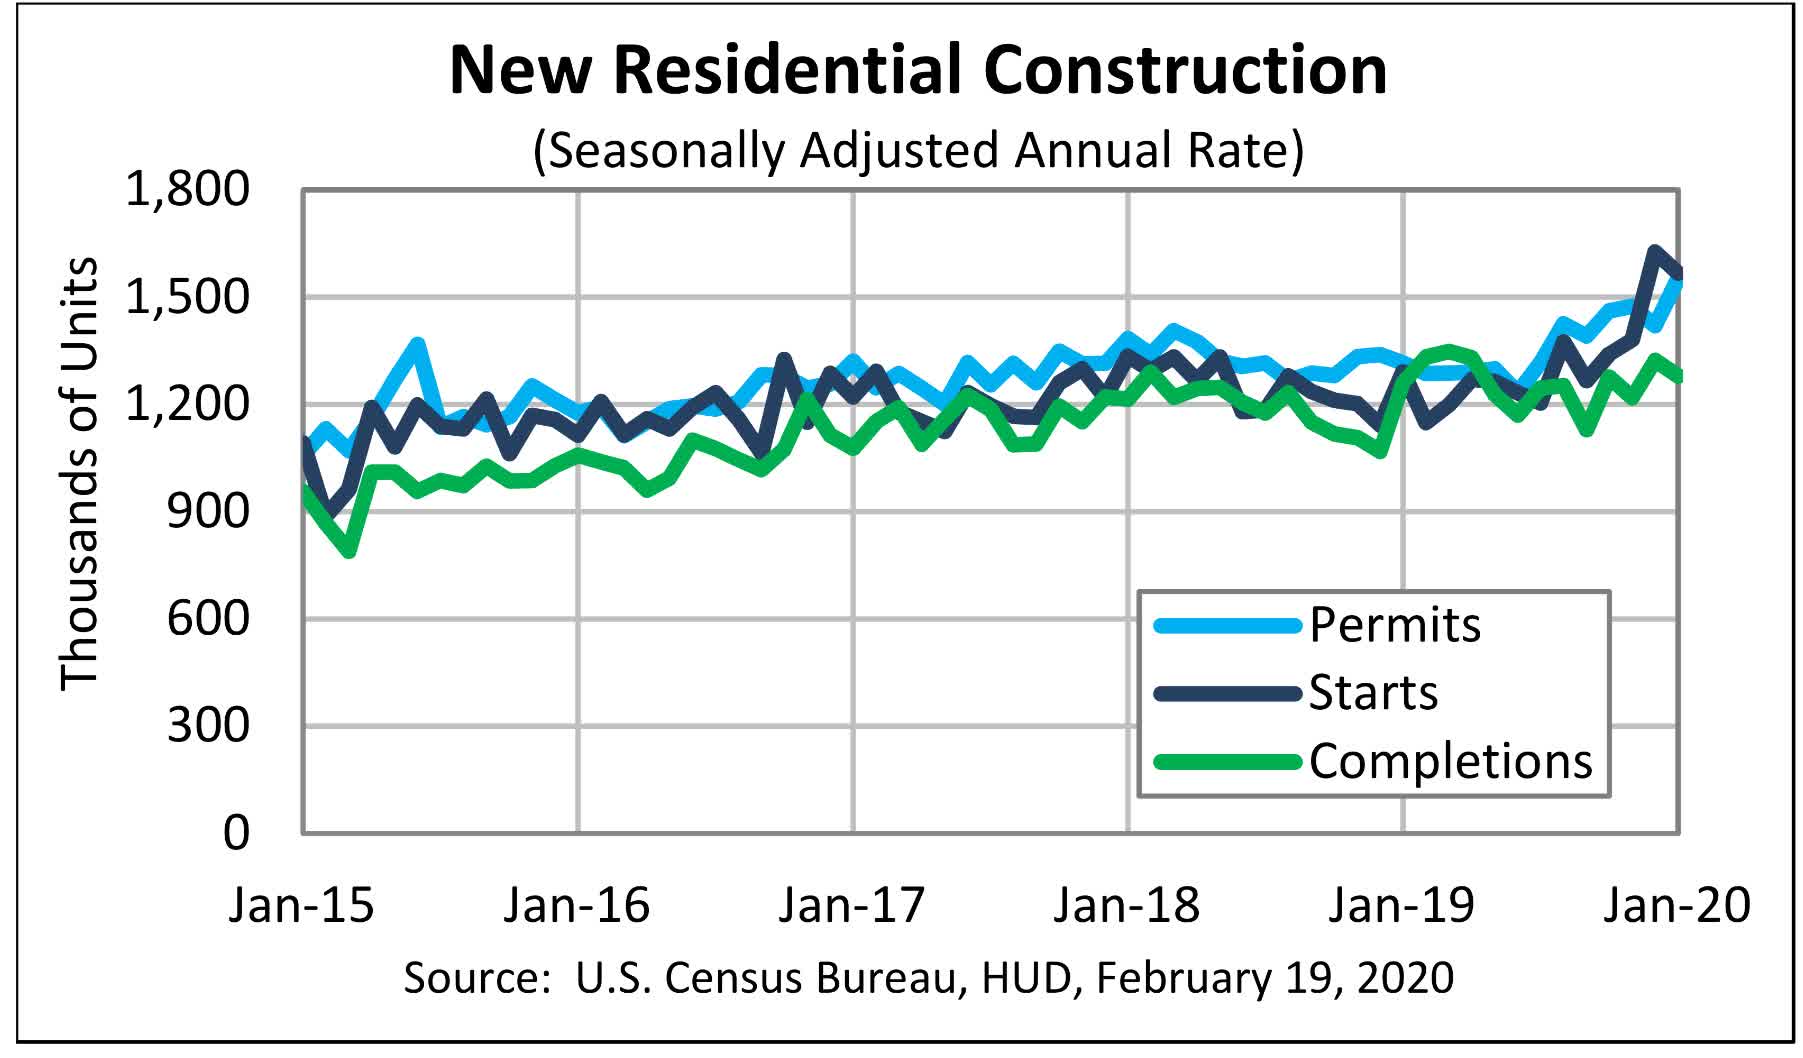
Low interest rates continue to fuel a strong upsurge in new housing construction.

I’ll put up a more detailed post later, but for now simply note that housing permits, both overall and for the less volatile single family housing component, made new expansion highs, at levels not seen since 2007. Housing starts backed off from December - but to only the second highest numbers of the entire expansion.

Here’s the graph from the Census Bureau:


This is extremely bullish for the economy at the end of this year and into next year.

Tuesday, February 18, 2020

Regional Fed Manufacturing Indexes Improving


 - by New Deal democrat

It’s been a really slow newsweek so far, with no important data until tomorrow.  Until then, here’s a note of interest.

This morning's Empire State Manufacturing Survey was the third regional report in a row (after Richmond and Dallas in the last week of January) to show a strong rebound in strength, as the new orders index jumped 15.5 to 22.1 (values over zero indicate improvement).

Here’s what the average of the five regions look like as of now (this is taken straight from my weekly update):

Regional Fed New Orders Indexes
(*indicates report this week) 
The regional average had been only +3 only 3 weeks ago. A reading of +13 shows pretty strong growth on the order of what we saw in 2018.
Between coronavirus fears and always the possibility that Tariff Man launches new trade wars, I’m not making any promises about where this goes from here. But for now, a clear rebound in manufacturing.

Saturday, February 15, 2020

Weekly Indicators for February 10 - 14 at Seeking Alpha


 - by New Deal democrat

My Weekly Indicators post is up at Seeking Alpha.

Several of the coincident indicators that turned positive one week ago turned right back to negative this week. The bifurcation between the producer and consumer sides of the economy continues.

As usual, clicking over and reading should be educational for you, and ever so slightly enumerative for me.