- by New Deal democrat
Below is a graph I put together in a discussion of transportation that I’ll probably post next week at Seeking Alpha.
The idea behind the graph is that (1) everything that is produced needs to be transported to market; i.e., the two metrics should move essentially in tandem (this is known as the “Dow theory” in financial markets); and (2) sales also ought to reflect - and slightly lead - what is being transported to market, since production is geared to match anticipated sales.
Anyway, here it is:
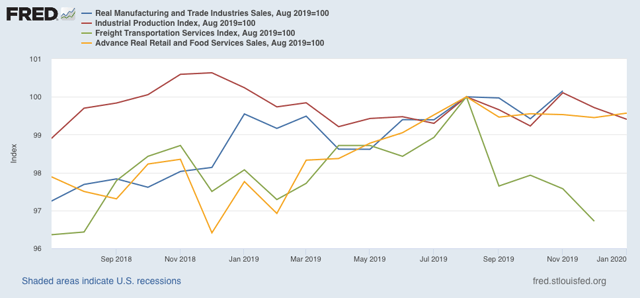
What we see is that production, transportation, and sales are all either flat or down since then. Although I didn’t include it, real personal income is only up +0.2% since then. Only jobs continue to show significant growth.
In short, since 6 months ago the economy has been in a very real slowdown, and in many respects has stalled.
Note that this is a nowcast, not a forecast, so you shouldn’t project this forward. But given how badly coronavirus is affecting China’s output, if the economy otherwise remains weak for the next several months, that might be enough to tip it into contraction.