Thursday, December 15, 2011

Is Food Inflation Still an Issue?

I'm in the process of switching servers for my Quote trak machine, so the morning market won't be up for the rest of the week.  

I haven't talked about or discussed food inflation for awhile, so I wanted to take a look at this area again.  What really got me interested in this topic is the drop in the grain complex:


Corn, soybeans and wheat are all at or near six month lows.  These form the building blocks of US food prices as these materials and their by-products are used throughout the US food complex.  Let's now turn to the CPI numbers:


Overall CPI's YOY percentage change is still high at a little under 4%.  However, it did drop recently.


In addition, core inflation is still rising; it is currently above 2%.

So the biggest and most inclusive readings of inflation are still running hot on a YOY basis.  Let's look at the food data:


The overall YOY food index is still increasing, and is now just below 5%. 


A big reason for the increase is the sharp increase in meat, poultry, fish and eggs.   However,


Fruits and veggies are still increasing a little over 5% YOY -- although these prices are subject to some fairly extreme fluctuations.


Cereals and baked goods are still rising and are now over 5% YOY.  Finally,


daily prices are also rising --  but have been through two similar spikes over the last 10 years.

While grain prices have been dropping (thanks to a risk aversion trade, bumper crops increased international supply competition, food inflation here in the US is still an issue to be concerned about.  In addition, overall inflation (both core and total) is at uncomfortable levels as well.

Wednesday, December 14, 2011

Bonddad Linkfest

  1. House votes to extend payroll tax cuts
  2. How many jobs will Keystone really create? 
  3. Tensions in the EU mount over deal
  4. Italian 5-year yields at high
  5. OPEC nears output deal
  6. FOMC statement
  7. BOJ loan facility gets strong demand
  8. The structural unemployment debate rages on
  9. Hiring, quits and layoffs
  10. Dollar breaks out

A peek inside ECRI's black box

- by New Deal democrat

Lakshman Achuthan's loud reiteration of ECRI's recession call last week, especially in the face of recent positive economic surprises, certainly has commanded attention. ECRI has an impressive record, especially their incredibly gutsy call in the midst of economic freefall in March 2009 that the "great recession" would bottom that summer. It did.

But ECRI's forecasts are surrounded by suspicion because of its (understandable) lack of transparency. The elements of both the Long Leading Index and the Weekly Leading Index, which it apparently uses in tandem to make its forecasts, are understandably kept in the proverbial black box, otherwise how could it charge its subscribers?

While I claim no proprietary knowledge of any of ECRI's methods, its history, hints about what is and is not in the indexes that have been dropped over time, and some reverse engineering can give us a glimpse inside their black box. So, what is it that ECRI is seeing, that didn't just to make their recession call three months ago, but to stick with it despite signs of a recent rebound?

A good place to start is with the work of Prof. Geoffrey Moore. ECRI was founded by him, and is based on decades of work on economic indicators he performed while at Columbia University. While some of his indicators apparently did change over time, we do know that he believed that some persisted from well before World War 2. As a reminder, here is a chart he himself published in 1961 explaining a number of leading indicators that functioned equally well borth before and after the War:
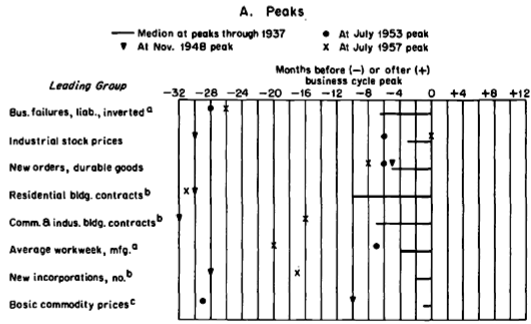


The above graph and the information contained in Moore's article make it fairly clear that he leaned heavily towards manufacturing and commodity data in his index.

Since stock prices were one of the leading components of his work, let's start with those. Here is a graph of the S&P 500 for the last 12 months:


Stocks fell 20% in August, and have only regained about 1/2 of that loss since then. They are still below their level of 6 months ago. John Hussman apparently relies in part on this metric as well in making his recession call.

If our stock market is below where it was 6 months ago, those of two of our trading partners are even worse. Here's a one year graph of Europe:


And here's a three year graph of China:


Europe isn't even half the way back from its low to its 12 month high. It's down about 30% from that peak. China is even worse. The Shanghai stock market has generally been in a downtrend for the last 2+ years, and Shanghai appears to be the stock market that now leads the rest of the world. These suggest that our economy will continue to import weakness from both of these sources.

Based on Moore's graph above, and based on its proven long leading relationship, another component of ECRI's long leading index is likely to be housing. According to work done by Prof. Edward Leamer, housing appears to turn about 12 to 15 months before the top of the business cycle. While housing permits have recently turned up mildly (red below), here is what they looked like 12 months ago (blue):


The post housing credit nadir was in January of this year, meaning we can expect it to feed through into the first quarter or so of 2012 before abating.

Another item believed to be a part of ECRI's long leading index is corporate profits. Sure enough, when we take corporate profits, and adjust for inflation by using the PPI, corporate profits routinely top out about 1 year or so before the onset of recession, as shown in this graph:


While corporate profits rose in the 2nd and 3rd quarters, they are still below their 2010 post recession peak when adjusted for producer price inflation.

A comparison of commodity prices (red) vs. consumer price inflation (blue) is consistent with the idea that when companies are unable on a sustained basis to pass on increased costs to consumers, then companies cut back, commodity prices fall, and more than consumer prices which also fall as demand temporarily decreases. Once companies are able to profit again, the recession abates:


In past work I have found that in the case of deflationary busts (with at least 3 consecutive months of decreasing prices), the recession typically bottoms at the point where the YoY deflation rate reaches its nadir, as for example happened in June 2009:


Here is a bar graph showing GDP over the same period of time as the graph above. You can see that deflation typically occurs during or just after the slowdown as measured by GDP:


As the gasoline price spike of November 2010 through April 2011 is gradually replaced in YoY inflation statistics (as to which recall that Prof. James Hamilton of UCSD has found that increases in gas prices have their biggest effect on the economy 12 months later), we may be starting a brief period of monthly deflation in line with the deflationary periods shown above. This is consistent with the paradigm of corporate cutbacks in the face of declining profit margins. In this regard, Jeff Miller of A Dash of Insight worryingly tells us that forward corporate earning estimates have indeed stalled.

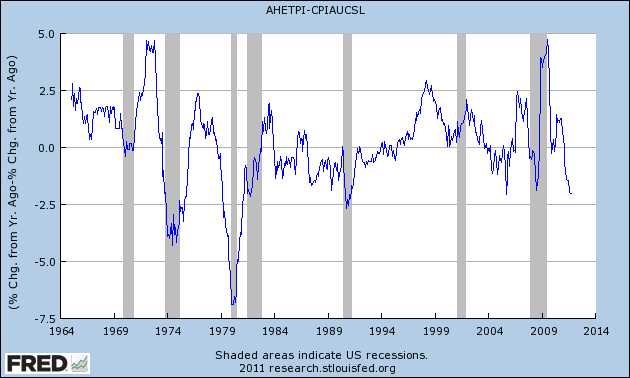
Further to this point, recently I have also noted that when real wages fail to keep up with consumer price inflation, in the absence of the ability to borrow or to refinance, consumers have little choice but to cut back. And real wages have indeed failed to keep up with consumer inflation in 2011:


The above discussion of corporate and consumer slowdowns brings us to commodity prices, another indicator cited by Prof. Moore as a short leading indicator. Here is Bloomberg's graph of commodity prices using various indexes for the last 12 months:
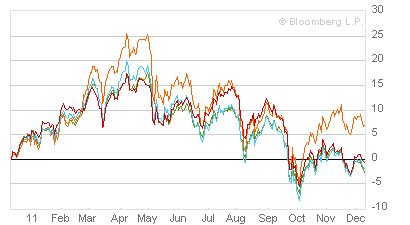


Measured by any index these peaked in about April and have generally been in decline since. Unlike other indexes which also plummeted this past summer, such as consumer confidence, commodity prices have continued to fall, again probably influenced by the deteriorating conditions in Europe and China. They made new 6 month lows shortly before ECRI made its official recession pronouncement, and have generally continued to fall since.

Another leading indicator cited by Prof. Moore that is somewhere between a short and long leading indicator is new orders for durable goods. A perfect example of this is auto sales. Again, while these have recently improved considerably (red), 6 months ago they were undergoing a temporary slump:


Finally, let's look at one last short leading indicator believed to form part of ECRI's index, credit spreads. As shown in this graph starting in 2000, credit spreads between BAA corporate bonds (blue) and 10 year treasury bonds (red) tend to widen just before and during recessions. Indeed, at least during the beginning part of a recession, business weakness may cause corporate bond yields to spike, while treasury yields decline given their status as a safe haven:


Here is a close up of the same data for the last 12 months:


As you can see, credit spreads began to widen in spring, and opened up much wider in August. Like commodity prices, they have not rebounded much at all since then.

To summarize: all of the above information grows out of the work of Prof. Geoffrey Moore, and/or interviews or statements that Lakshman Achuthan has made at one point or another. It represents a best guess as to what at least some of the data in their black box is showing ECRI. You can see that, taken together, it makes a very powerful bearish case for the onset of recession at some point probably no later than Q2 2012.

Am I persuaded? Not yet. Housing permits have indeed been in a small uptrend for the last 10 months, and car sales in a strong one for the last five. The Dow Jones Corporate Bond Index also continues to be in a small but definite uptrend. Consumer confidence is improving. Initial jobless claims are decreasing. YoY money supply, both M1 and M2, are also strongly positive. Manufacturing employment remains slightly positive.

Even more importantly, the decline in commodity prices, particularly oil, while showing weakness in Europe and Asia, is a boon to American consumers.

In short, three months after ECRI's recession call, I don't yet see weakness crossing either the Atlantic or the Pacific sufficiently to create a recession here.


Tuesday, December 13, 2011

Morning Market


The above chart shows the strength of the dollars action over the last two days.  Notice the strong gap higher on Monday, followed by two strong intra-day rallies yesterday.


But the above daily chart is the real eye-opener.  Prices moved through key resistance yesterday on rising volume.


After moving lower Monday, prices moved lower yesterday in the gold market.


Like the dollar, gold prices have moved sharply lower on higher volume and have now traded through key support.

Oil prices are now in a symmetrical triangle pattern.  Pay particular attention to yesterday's price action as oil prices rose when the dollar moved lower -- a very unusual development.

The Myth of the Center For Freedom and Prosperity's Economic Competency

First, watch the video below.  No, really, please watch it.  Try not to laugh.


Done yet?  Good.

Now -- what's missing from the above presentation?  Anybody?  Bueller.. Bueller?

DATA.  As in there isn't any.  In a video on the Great Depression -- in a presentation on economics -- there isn't one chart, graph or picture of numbers in any way shape or form.  Gee .. I wonder why that is?  Could it be that the facts completely debunk what this morons are arguing?  Nah ... they wouldn't want to distort history for a political agenda, would they?

For those of you that what to read an exhaustive set of research on the topic, NDD and I co-authored a set of pieces at the Huffinton Post which you can see here, here, here and here.  Let me hit some of the high points.
First, here is a chart of total GDP for the US economy, inflation adjusted:


GDP dropped from 1929-1933.  Yet by 1937 the absolute level of inflation adjusted GDP was higher than 1929.  GDP dropped in 1937 because Congress went into -- wait for it -- austerity mode -- and sent the economy into recession.  The reason for the nice increase?


A very high rate of growth -- as in right around 10% for three years running and then 5%.  That's an incredibly strong rate of growth.

And no -- government did not kill investment.


Inflation adjusted real gross domestic investment dropped from 1929 to 1933, but was back to 1929 levels by 1937.


And industrial production had also returned to 1929 levels by 1937.

And the unemployment rate actually dropped from 20% to around 10% during the decade:


As either NDD or I wrote wrote in the piece:
(Note: the dotted line is the official current calcuation of the Historical Statistics of the United States that counts workers employed in government makework/infrastructure jobs; the solid line, commonly used by New Deal doubters, is an outdated, former series) that treated such workers, who earned a paycheck, as unemployed!)

Here's the reason for the difference in umemployment readings:
These estimates for the years prior to 1940 are intended to measure the number of persons who are totally unemployed, having no work at all. For the 1930's this concept, however, does include one large group of persons who had both work and income from work--those on emergency work. In the United States we are concerned with measuring lack of regular work and do not minimize the total by excluding persons with made work or emergency jobs. This contrasts sharply, for example, with the German practice during the 1930's when persons in the labor-force camps were classed as employed, and Soviet practice which includes employment in labor camps, if it includes it at all, as employment
The solid line -- the one the revisionists love -- still shows very solid job growth over a decade.  For unemployment to drop from 25% to 15% is a remarkable achievement.  But that number is a complete fiction as explained above.  

Oh yeah -- NDD and I spent the entire fourth article dedunking the revisionist arguments -- which are pure, USDA, grade A bullshit.

In short, the revisionist history presented by the Center for Bullshit and Propaganda's misinformation arm is an utter failure when one actually looks at the data -- something their uncritically thinking (or just plain stupid) followers will fail to do.

Here's the deal.  If you want to have a serious discussion about economics, you need to talk in the language of economics.  That means looking at charts, graphs and data.  The video presented by these yahoos is completely devoid of any hard data.  To the trained seals of the political blogshere, I'm sure it will work, especially when their readership has the IQ of an ashtray and the editors have all the intellectual heft of Mr. Magoo.  Well, homey don't play that crap.  When you have data that contradicts the above charts, please, by all means, put it up.  But until then, why not leave the heavy intellectual lifting to those who can do it  .. like one of my dogs.

PS: have a nice day. 


Morning Market


One of the biggest moves yesterday came from Gold, where prices dropped sharply through support at the open, and then moved sideways for the remainder of the session.


On the daily chart, notice that prices dropped hard, and are now approaching long-term support.  The EMAs are giving little indication of future direction; they are essentially tied together right now.


The SPYs 10-day chart is looking very much like a rounding top, indicating further moves lower. 


In contrast, the dollar rose sharpy yesterday on decent volume.  Also note that prices are approaching key resistance levels.  The EMAs are indicating further appreciation with all moving higher and the shorter above the longer.

Oil is still consolidating as well.  However, the MACD is moving lower and the last two days have printed some strong downward bars -- not a good sign for the bulls, especially as prices were approaching key resistance levels.  


Monday, December 12, 2011

Bonddad Linkfest

  1. OECD LEIs point to global slowdown
  2. China looking to simulate the economy again
  3. Japan lowers GDP growth for 3Q
  4. German GDP expected to slow
  5. Current economic conditions
  6. Worries continue
  7. Why are WTI and brent prices so different?
  8. CFOs are less optimistic about US growth
  9. Bernanke's letter on bank lending (PDF)
  10. All the Fed bashing has gone too far

Why Europe Will Solve Their Problems

Over the last year, the EU situation had been one of the dominant stories.  More importantly, the editorial community has continually stated that each plan was deeply flawed and therefore the end of the EU was near.  Regarding this constant stream of negative news it's important to point out two facts: first, negative reviews increase headlines and web traffic.  Second, none of these reviews -- at least to my knowledge -- has touched on the primary reason for the creation of the trading bloc and therefore why the EU will eventually solve their problems.

Back in the 1990s, Europe faced two problems.  First, it's overall power on the world stage has fading.  While Germany, France and England would be invited to all the important diplomatic events, they weren't real power brokers anymore.  The continent was well aware of this fact and wanted to be dealt back in.  At the same time, on the world stage, political power was slowing beginning to take a back seat to economic power.  Remember this is the time when Clinton was trying to get China admitted to the WTO; the BRICs were slowly starting to emerge as their own power centers and Asia was clearly on the rise thanks to its economic heft.  The EU realized that if they combined their forces they would again be powerful because that power would be derived from their common economic market whose size rivaled the US'.
Secondly,  imagine this scenario.  A French company wants to sell its product across the continent.  They ran into as many economic and legal systems as there were potential trading partners.  And while some harmonization was underway, it still had a long way to go. 

So -- we have a region that if they combined their forces -- would provide a political counter-weight to the US, but that weight had to come from their political unity.  Hence the formation of the trading block.

Let's fast forward 10 years.  I can tell you that -- at least from a tax perspective -- the genie is out of the bottle and can't be put back in.  When talking about moving money within the block , tax planners have one basic basic strategy; get money into the region in some capacity.  At that point, moving money between countries (and hence profits) is a remarkably uniform affair.  People now move across borders easily as well.  And now we have macro-economic structures such as the ECB and to a lesser extent IMF that help to bring the region together economically.   In short, integration has already moved forward; unwinding it would be nearly impossible.

Does that mean there aren't problems?  Nope.  We are currently running into what is perhaps the biggest one: a common currency with multiple budgets below it.  That has to be dealt with in a comprehensive manner.  And dealing with it is incredibly difficult -- hence the multiple plans that have emerged and the length of time it has taken to solve the problem.  Put another way, this is not a problem that will be solved easily or overnight.  The reasons pundits can't see this is, 1.) they have no practical dealings with the region and hence talk entirely from a theoretical perspective, 2.) they talk entirely from a political perspective that dislikes the idea of EU unity (or just the EU) and hence are predisposed to dislike everything that comes out of the region. 

However, disunity is simply not an option if the region wants to remain a power player on the world stage.  And that is what will eventually force the region to solve their problems. 

Sunday, December 11, 2011

Morning Market

Remember that three major markets are consolidating:


All are consolidating for different reasons.

1.) The equity market is stuck between bullish and bearish economic sentiment.  The bulls can point to the improvement in the labor market, the fact the US is still printing positive GDP numbers, the healing of the supply chain after the Japanese earthquake and the still positive ISM numbers.  The bears can point to Europe and China's managed slowdown.

2.) The bond market bulls are concerned about the EU situation, and are therefore bidding up Treasuries.  However, the IEFs and TLTs are right at support, indicating a trend break may be approaching.   What would drive this move would be a successful resolution of the European situation along with adequate bullish news about the U.S. economy that would drive money from the bond market into the equity market.

3.)The dollar is caught between bearish sentiment caused by very low interest rates, an extremely accomodative Fed on one hand and being the "least dirty shirt in the hamper on the other.  In other words -- it's an alternative to the euro, but certainly not the most viable.

There are two ways this plays out.

1.) The EU solves its problems.  At this point, the major storm could hanging over the US economy is lifted, meaning stocks rally and bonds sell off.

2.) The EU crashes and burns.  Reverse point number 1, except don't expect a major bond market rally as prices are already incredibly high, so the rally would be in the dollar. 


Saturday, December 10, 2011

Weekly Indicators: 'Tis the seasonality edition

- by New Deal democrat

Monthly data was light this past week. Factory orders for October were down -0.4%. This series has gone flat for the last 3 months. The ISM non-manufacturing index also softened, but remained positive. The University of Michigan's preliminary December consumer confidence report was up more than expected. The expectations index, one of the 10 LEI, was up sharply, having regained over half its loss from July's debt ceiling debacle.

The high frequency weekly indicators are at the point where holiday seasonality strongly affects their week over week performance. YoY comparisons are more important, but whether those comparisons are improving or deteriorating is most important. Most of these indicators again showed strength, with the exception of tax withholding, money supply, and gasoline usage. I again remind new readers that my "Weekly Indicators" column is not designed to be a big picture forecast of the future, but rather by use of high frequency data to capture an up-to-the-minute snapshot of the economy as it is right now.

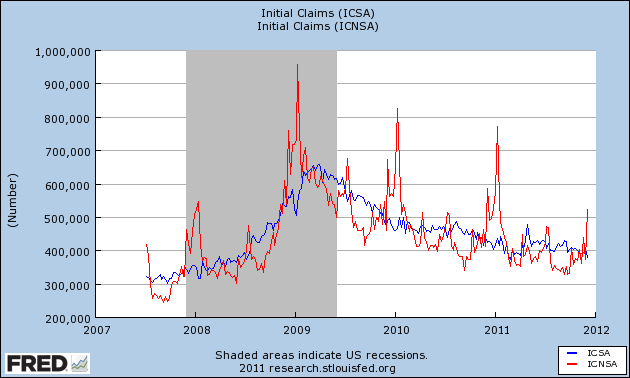
Starting with jobs, the BLS reported that Initial jobless claims declined by 21,000 to 381,000. With the exception of one week last March, this is the lowest initial claims figure in over 3 years. The four week average declined by 2500 to 393,250. This is the first week where year-end seasonality is significant, as shown in this graph:


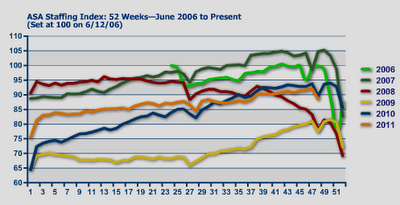
The American Staffing Association Index declined by 3 to 89 last week. This is entirely due to Thanksgiving week seasonality. This series is now just barely below last year's levels, after stagnating earlier this year, as shown in this graph:


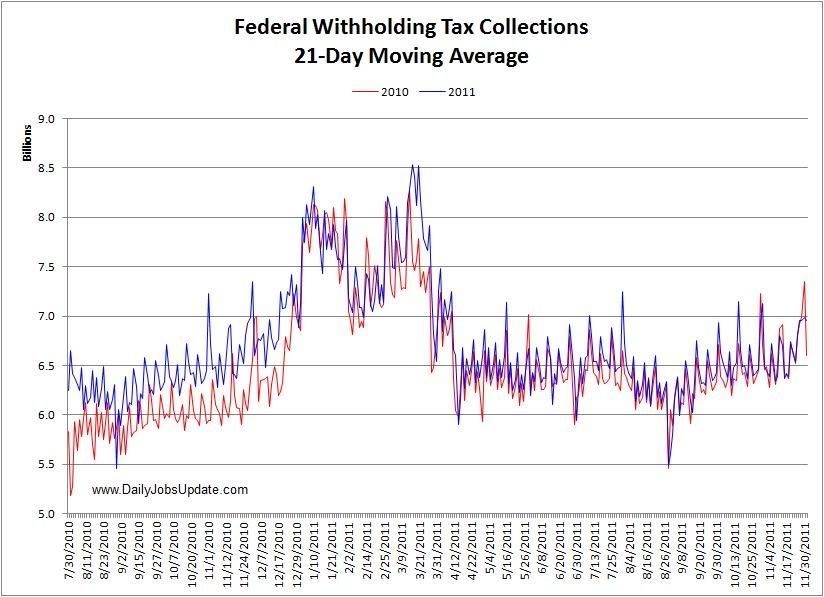
Adjusting +1.07% due to the 2011 tax compromise, the Daily Treasury Statement showed that withholding for the first 6 days of December stood at $41.8 B vs. $44.8 B a year ago. For the last 20 reporting days, $136.5 B was collected vs. $134.1 B a year ago, a gain of $2.1 B or +1.8%. I am indebted to Matt Trivisonno of the Daily Jobs Update, who sent me the following graph of the 21-day moving average of withholding tax receipts (red is 2009-10, blue is 2010-11) :


As Matt explains, "It was clearly running ahead last year, and has been neck-and-neck this year, due to the tax cut of course. In September and October, the dips in the 2011 line were consistently above the 2010 line, though you have to squint to see it. Since November, the lines are neck-and-neck again." More graphs and information about withholding tax receipts are available at his site.

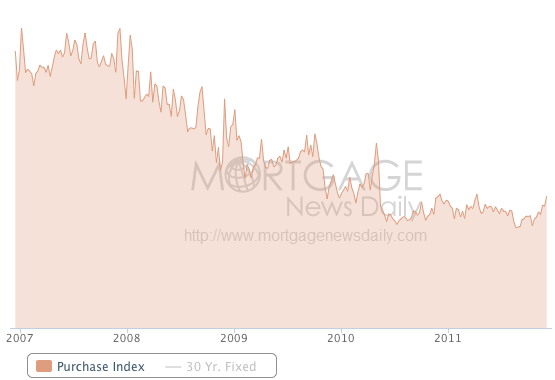
The Mortgage Bankers' Association reported that seasonally adjusted purchase mortgage applications increased 8.3% last week. On a YoY basis, purchase applications were down -0.8%. This primarily reflects a multi-week spike last year vs. flatness this year. The actual reading remains firmly within the range that purchase mortgage applications have been in since May 2010. Refinancing rose +15.3% w/w, exactly reversing its -15.3% decline during the shortened Thanksgiving week. Refinancing continues to be extremely volatile. Purchase mortgage applications have actually been rising for the last 3+ months, as this graph from Mortgage News Daily shows:


For the second week in a row, YoY weekly median asking house prices from 54 metropolitan areas at Housing Tracker were positive, up +0.1% YoY. The areas with YoY% increases in price increased by 1 to 21. Only Chicago continued to have a double-digit YoY% decline.

Retail same store sales were decidedly mixed, as one service reported the lowest YoY gain all year. The ICSC reported that same store sales for the week ending December 3 increased 3.8% YoY, and 2.3% week over week. Shoppertrak, however, reported that YoY sales rose a mere 0.2% YoY and were off a huge -22.5% week over week.

Weekly BAA commercial bond rates increased .17% to 5.18%. Yields on 10 year treasury bonds increased less, up .10% to 2.04%. In the last few weeks, spreads have widened again, representing increasing weakness.

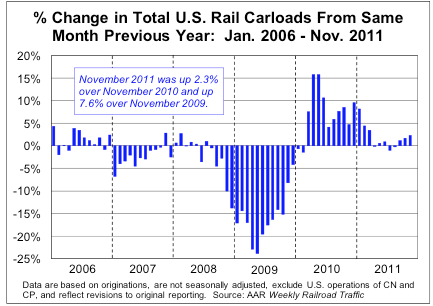
The American Association of Railroads reported that total carloads increased 3.1% YoY, up about 16,700 carloads YoY to 555,400. Intermodal traffic (a proxy for imports and exports) was up 8200 carloads, or 3.5% YoY. The remaining baseline plus cyclical traffic increased 8500 carloads or 2.8% YoY. Total rail traffic has staged an impressive rebound in the last couple of months, as shown in this graph:


Money supply has been flat or down since its Euro crisis induced tsunami of several months ago. M1 increased +0.1% last week, and was unchanged month over month. It is now up 17.9% YoY, so Real M1 remains up 14.3%. This is about 6% under its peak YoY gain several months ago. M2 was unchanged both w/w and month over month. It remains up 9.4% YoY, so Real M2 was up 5.8%. This is also significantly less than its YoY reading at the crest of the tsunami.

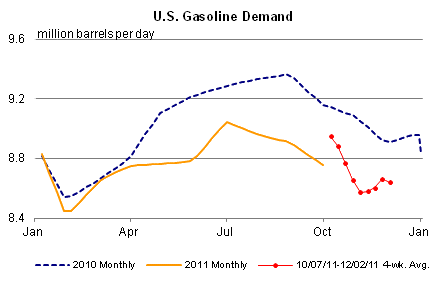
Finally, the Oil choke collar remained in place, as Oil closed at $99.41 a barrel on Friday. This about $4 above the recession-trigger level calculated by analyst Steve Kopits. Gas at the pump, however, decreased $.02 more to $3.29 a gallon. Measured this way, we probably are only about $.05 above the 2008 recession trigger level. Gasoline usage, at 8574 M gallons vs. 9171 M a year ago, was off a whopping -6.5%. The 4 week moving average is off -3.5%. This returns to the pattern of dramatically less usage YoY that started in March and intensified in the last few months, as shown in this graph:


The overall picture continues to be an economy that is expanding again after its summer stall, but the recent stagnation in money supply and $100 Oil are indicative of strong headwinds going forward.

Have a nice weekend.

Friday, December 9, 2011

Take yesterday's initial claims number with a little grain of salt

- by New Deal democrat

With the exception of only one other week, yesterday's report of 381,000 initial jobless claims was the lowest in more than 3 years. While it is certainly reason for some optimism, keep in mind that with this week we have entered the period where the biggest seasonal adjustments have to be made to the raw initial claims number. As this graph of seasonally adjusted initial claims (blue) vs. unadjusted claims (red) shows, sometimes the seasonal adjustment can "overshoot" slightly (2007, 2008, 2009) and sometimes it appears on target (2010):


The large drop -- over 20,000 -- this week makes me suspect there may be a little bit of an overshoot at work.

Don't ignore the number. If there is an overshoot it may only be 5,000 or 10,000. But take this number, and the numbers for the next month or so, with a little grain of salt.