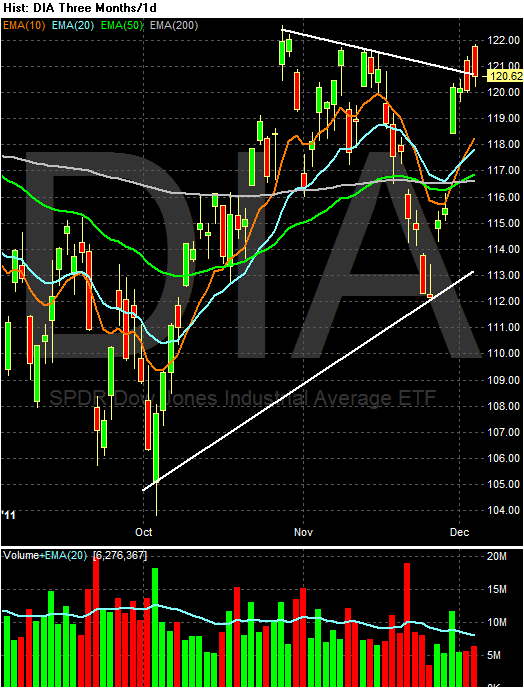
Below are charts of major market ETFs. Notice that all are currently in some type of consolidation trend, meaning most of the equity market's sectors are also consolidating right now.
Friday, December 9, 2011
Thursday, December 8, 2011
Morning Market
Over the last few days, I've expressed concern about the rally in the markets, largely because the overall price action has been weak and the volume low. Yesterday's action confirmed my concerns with the market printing an extremely poor day. Prices have moved through the upper trend line of the consolidation triangle.
The above chart shows that after a decent rally, prices stalled in the 125-127 price area. However, yesterday, prices moved lower, breaking support.
Prices gapped lower at the beginning of the session and continued to move lower throughout the day. They rallied into the 20 minute EMA, and attempted to move through the 50 day EMA, only to fall into the close on increasing volume.
What Does "Not in the Labor Force" Mean?
There is a good and bad point about the internet. It has greatly increased the number of people who can write and provide opinions about things. This is also bad, as there are a lot of people out there who have no idea what they're talking about. Case in point: Friday's jobs report and the 487,00 increase in the number of people "not in the labor force." To the average commenter -- the one who doesn't bother to look up what this term means to the BLS -- this means all those people gave up looking for work, indicating the economy is in fact terrible. However, that's just not the case.
From the BLS
According to the latest employment report, the civilian non-institutional population was 153,883,000 (which is the total number of people employed and unemployed) while the total non-institutional population was 240,441,000. This means there are 86.558 million people who are not in the labor force.
Let's take a look at some data:
The above chart is the total figure for "not in the labor force," not seasonally adjusted. Notice that this number has been slowly creeping up since the end of the 1990s. Put another way, the increase is hardly a new development, and probably has something to do with the aging baby boomers.
The above two charts show the number of men and women not in the labor labor force who want a job now -- this is the category that many people are talking about. Notice that we're actually talking about 6 million people in these charts -- or about 7% of the total amount of people who "aren't in the labor force."
The above chart is the people "not in the labor force" but have searched for work and are available. Notice this number is about 1.675 million -- with is a little under 2%.
The BLS phrase, "not in the labor force" is a statistical term; if you're going to use it, it helps to first understand what it means. The vast number of people who are using the term are doing so for political reasons -- without clearly understanding the term.
So, to review
1.) Not in the labor force is a statistical measure, and is primarily comprised of retirees and students.
2.) Labor under-utilization -- which is what most people are concerned with when it comes to this statistic -- actually represents less than 10% of the "not in the labor force" number.
And no, I am not trying to make light of the plight of the unemployed. However, it's also important that we understand the terms and definitions we're using in order to properly discuss what we're talking about.
From the BLS
Labor force measures are based on the civilian noninstitutional population 16 years old and over. Excluded are persons under 16 years of age, all persons confined to institutions such as nursing homes and prisons, and persons on active duty in the Armed Forces. As mentioned previously, the labor force is made up of the employed and the unemployed. The remainder—those who have no job and are not looking for one—are counted as "not in the labor force." Many who are not in the labor force are going to school or are retired. Family responsibilities keep others out of the labor force.Let's look at this in more detail.
A series of questions is asked each month of persons not in the labor force to obtain information about their desire for work, the reasons why they had not looked for work in the last 4 weeks, their prior job search, and their availability for work. These questions include:
These questions form the basis for estimating the number of persons who are not in the labor force but who are considered to be "marginally attached to the labor force." These are persons without jobs who are not currently looking for work (and therefore are not counted as unemployed), but who nevertheless have demonstrated some degree of labor force attachment. Specifically, to be counted as "marginally attached to the labor force," individuals must indicate that they currently want a job, have looked for work in the last 12 months (or since they last worked if they worked within the last 12 months), and are available for work. "Discouraged workers" are a subset of the marginally attached. Discouraged workers report they are not currently looking for work for one of four reasons:
- Do you currently want a job, either full or part time?
- What is the main reason you were not looking for work during the LAST 4 WEEKS?
- Did you look for work at any time during the last 12 months?
- LAST WEEK, could you have started a job if one had been offered?
Additional questions about persons not in the labor force are asked during each household's last month of its 4-month tenure in the sample rotation pattern. These questions are designed to collect information about why these people left their previous jobs, when they last worked at a job or business, and whether they intend to look for work in the near future.
- They believe no job is available to them in their line of work or area.
- They had previously been unable to find work.
- They lack the necessary schooling, training, skills, or experience.
- Employers think they are too young or too old, or they face some other type of discrimination.
According to the latest employment report, the civilian non-institutional population was 153,883,000 (which is the total number of people employed and unemployed) while the total non-institutional population was 240,441,000. This means there are 86.558 million people who are not in the labor force.
Let's take a look at some data:
The above chart is the total figure for "not in the labor force," not seasonally adjusted. Notice that this number has been slowly creeping up since the end of the 1990s. Put another way, the increase is hardly a new development, and probably has something to do with the aging baby boomers.
The above two charts show the number of men and women not in the labor labor force who want a job now -- this is the category that many people are talking about. Notice that we're actually talking about 6 million people in these charts -- or about 7% of the total amount of people who "aren't in the labor force."
The above chart is the people "not in the labor force" but have searched for work and are available. Notice this number is about 1.675 million -- with is a little under 2%.
The BLS phrase, "not in the labor force" is a statistical term; if you're going to use it, it helps to first understand what it means. The vast number of people who are using the term are doing so for political reasons -- without clearly understanding the term.
So, to review
1.) Not in the labor force is a statistical measure, and is primarily comprised of retirees and students.
2.) Labor under-utilization -- which is what most people are concerned with when it comes to this statistic -- actually represents less than 10% of the "not in the labor force" number.
And no, I am not trying to make light of the plight of the unemployed. However, it's also important that we understand the terms and definitions we're using in order to properly discuss what we're talking about.
The WSJ misleads, Mish misreads temporary employment data
- by New Deal democrat
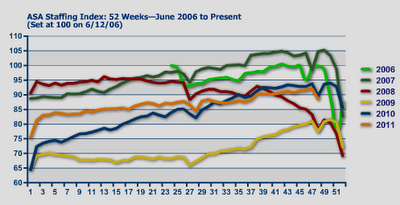
This morning the WSJ has an article entitled Demand for Temp Help Cools including a graph of the YoY% change in the American Staffing Association index. This note was picked up by Mish, who furthers the analysis by including the American Staffing Association's graph of its staffing index beginning July 1, 2006, highlighting that the index has been lower YoY since mid-August.
Since this index is a component of my "Weekly Indictors" needless to say I am familiar with this data. While the data cited by both is accurate, the interpretation is misleading in the case of the WSJ, and Mish misreads it.
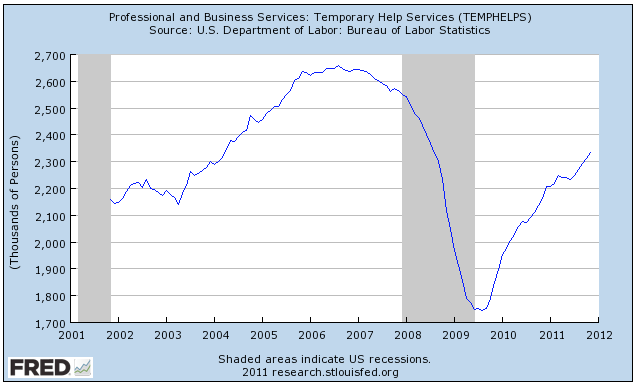
To begin with, temporary hiring is indeed a leading component of employment data, tending to both peak and trough before overall employment. To cut to the chase, here is the graph of temp hiring from the BLS employment report for the last 10 years:

Note that temp hiring peaked about 18 months before the recession began, and bottomed in late 2009 about 6 months before the bottom in employment generally. Secondly, note that this number briefly declined earlier this year and has since resumed its strong advance.
Simply put, temporary help in no way supports a claim that we are on the cusp of recession.
What is wrong with the WSJ analysis shows the shortcomings of relying on YoY comparisons. Because of seasonality, sometimes there is no choice but to do so, but in that case, you have to be mindful of the second derivative as well: are the YoY comparisons getting better or worse? Beginning in about March of this year, the YoY comparisons even while still positive began to deteriorate significantly. The YoY comparisons were at their worst at about the beginning of September, and since then have improved, even though they are still slightly negative YoY. This is easily seen on the ASA's graph of their employment index as reposted by Mish, which also shows that the raw ASA index number stalled in early summer, and since the beginning of autumn has resumed its improvement (as I have duly reported each week in my "Weekly Indicators" column):

Mish says:
Mish's analysis would have been spot on a few months ago during the summer employment stall, but is no longer true. Just as the ASA index's late 2009, 2010 and early 2011 readings were also "lagging 2006 and 2007", but still improving, meaning that temp services were increasing, so now even though November's readings were slightly below last November's readings, the index is increasing again, and indeed the YoY comparisons, while still negative, are slowly improving as well.
To repeat: the ASA temp service index is simply not now signaling a recession.
Bonddad here:
A long time ago in a galaxy far, far away, Mish did some great work. And he's still capable of doing that work. However, at some point in the last few years he because drunk with success and enthralled with his own political agenda. At this point, he became utterly useless as an economic analyst.
This morning the WSJ has an article entitled Demand for Temp Help Cools including a graph of the YoY% change in the American Staffing Association index. This note was picked up by Mish, who furthers the analysis by including the American Staffing Association's graph of its staffing index beginning July 1, 2006, highlighting that the index has been lower YoY since mid-August.
Since this index is a component of my "Weekly Indictors" needless to say I am familiar with this data. While the data cited by both is accurate, the interpretation is misleading in the case of the WSJ, and Mish misreads it.
To begin with, temporary hiring is indeed a leading component of employment data, tending to both peak and trough before overall employment. To cut to the chase, here is the graph of temp hiring from the BLS employment report for the last 10 years:

Note that temp hiring peaked about 18 months before the recession began, and bottomed in late 2009 about 6 months before the bottom in employment generally. Secondly, note that this number briefly declined earlier this year and has since resumed its strong advance.
Simply put, temporary help in no way supports a claim that we are on the cusp of recession.
What is wrong with the WSJ analysis shows the shortcomings of relying on YoY comparisons. Because of seasonality, sometimes there is no choice but to do so, but in that case, you have to be mindful of the second derivative as well: are the YoY comparisons getting better or worse? Beginning in about March of this year, the YoY comparisons even while still positive began to deteriorate significantly. The YoY comparisons were at their worst at about the beginning of September, and since then have improved, even though they are still slightly negative YoY. This is easily seen on the ASA's graph of their employment index as reposted by Mish, which also shows that the raw ASA index number stalled in early summer, and since the beginning of autumn has resumed its improvement (as I have duly reported each week in my "Weekly Indicators" column):

Mish says:
Since week 33 (mid-August), demand for temporary and contract help is below where it was for the same week in 2010. Although 2011 is substantially better than 2008 and 2009, it is now lagging 2010 and considerably lagging 2006 and 2007.
... [C]onsider the possibility employers are slowly dumping temps and contract workers, and permanent employees may be next.
Mish's analysis would have been spot on a few months ago during the summer employment stall, but is no longer true. Just as the ASA index's late 2009, 2010 and early 2011 readings were also "lagging 2006 and 2007", but still improving, meaning that temp services were increasing, so now even though November's readings were slightly below last November's readings, the index is increasing again, and indeed the YoY comparisons, while still negative, are slowly improving as well.
To repeat: the ASA temp service index is simply not now signaling a recession.
Bonddad here:
A long time ago in a galaxy far, far away, Mish did some great work. And he's still capable of doing that work. However, at some point in the last few years he because drunk with success and enthralled with his own political agenda. At this point, he became utterly useless as an economic analyst.
A Question For Bonddad Blog Readers
Hey folks -- this is Bonddad and I need some advice.
My wife and I are picking out Christmas gifts for my nephew. He's got an econ degree for UT and is a part owner in a business just north of San Antonio. He's very sharp from a money perspective, so I wanted to get him a good book on the markets.
I've settled on the following:
The Money Masters of Our Time
The Intelligent Investor by Benjamin Graham
One Up on Wall Street
Basically, he's got the raw knowledge, but I think it's the application of it that would be the most benefit. One of the ways that I learned about economics and the markets was to read these interviews, because it showed me how other people practically applied their knowledge.
Anyway -- does anybody have a preference -- or other recommendations?
My wife and I are picking out Christmas gifts for my nephew. He's got an econ degree for UT and is a part owner in a business just north of San Antonio. He's very sharp from a money perspective, so I wanted to get him a good book on the markets.
I've settled on the following:
The Money Masters of Our Time
The Intelligent Investor by Benjamin Graham
One Up on Wall Street
Basically, he's got the raw knowledge, but I think it's the application of it that would be the most benefit. One of the ways that I learned about economics and the markets was to read these interviews, because it showed me how other people practically applied their knowledge.
Anyway -- does anybody have a preference -- or other recommendations?
Wednesday, December 7, 2011
Morning Market
Over the last few days, I've expressed concern about the strength of the stock market's current rally. Yesterday only added to my concern. The top chart shows the daily chart, which is still moving sideways. Yesterday's price action merely lowered the consolidation range to 125 from 125.5.
The TLTs are right at long-term support. For a move lower to be significant, we'd need to see a move below at least 116.
Looking at the technicals, we see a strong inflow in the form a a risking A/D and CMF. But we also see declining momentum in the lower MACD. Normally, I'd be more inclined to rely on the volume metrics. But, remember that long-term prices are near historically high levels.
State Tax Revenue increased nominally, flat in real terms as of 3Q 2011
- by New Deal democrat
With the temporary lull in dramatic (US) economic direction, I have been updating a number of metrics I haven't looked at in awhile. Two weeks ago, I looked at leading indicators for jobs. Last week I examined real wages and the savings rate.
This week I'm revisiting state tax receipts. These lag the economy, and reports on state tax receipts badly lag even that. Because I knew they would turn up after the other data already had, I used to pillory Mish about sales tax receipts in particular. Needless to say, Mish, who used to religiously report these, stopped after they unequivocally turned against him. With last summer's near stall, however, in real terms these seem to have stalled as well as of the most recent (summer) reported data.
The Census Bureau has reported on state and local tax revenue collected in the second calendar quarter of 2011, and the Rockefeller Institute has also reported on preliminary collections from the third quarter.
According to the Rockefeller Institute report:
(p*=preliminary)
In summary, while in nominal terms state tax revenues have made back all but less than 4% of their entire shortfall off peak pre-recession revenues, measured in real terms they have stalled in the last several quarters. Meanwhile population has increased, and states have been facing record unemployment payouts. As I've said before, while there has been strong improvement, it still hasn't been enough.
With the temporary lull in dramatic (US) economic direction, I have been updating a number of metrics I haven't looked at in awhile. Two weeks ago, I looked at leading indicators for jobs. Last week I examined real wages and the savings rate.
This week I'm revisiting state tax receipts. These lag the economy, and reports on state tax receipts badly lag even that. Because I knew they would turn up after the other data already had, I used to pillory Mish about sales tax receipts in particular. Needless to say, Mish, who used to religiously report these, stopped after they unequivocally turned against him. With last summer's near stall, however, in real terms these seem to have stalled as well as of the most recent (summer) reported data.
The Census Bureau has reported on state and local tax revenue collected in the second calendar quarter of 2011, and the Rockefeller Institute has also reported on preliminary collections from the third quarter.
According to the Rockefeller Institute report:
State tax revenues grew by 10.8 percent in the second quarter of 2011, and by 8.4 percent annually for the period that ended the fiscal year for 46 states -- marking six straight quarters of growth and the strongest annual gains since 2005, ....Local governments, which rely heavily on property tax payments, are in worsening shape:
[E]very state but one (New Hampshire) reported an increase in overall tax collections compared to the year-ago period ....
[Further, p]reliminary figures for July and August 2011 suggest continued, though less robust, growth in revenues. Overall collections in 41 early-reporting states showed average gains of 6.8 percent compared to the same months of 2010.
....
Even for states, the longer term revenue picture remains mixed. Despite the recent gains, states' tax revenues remained lower in the second quarter than they were four years earlier.
Tax collections for local governments, meanwhile, have headed in the opposite direction. The second quarter of 2011 marked the third consecutive quarter of declines in local property tax revenues. In total, local property taxes declined by 1 percent in the second quarter of 2011 compared to the same quarter of 2010.Here is an updated graph of state tax revenues, seasonally adjusting by .775 for the second quarter (which includes April 15), beginning with the first fiscal quarter of 2008 (or the third calendar quarter of 2007) :
| Fiscal Quarter | Revenues* ($ billions) | Inflation- adjusted Revenues | % off of peak |
|---|---|---|---|
| 1Q 2008 | 176.4 | 183.8 | -1.5% |
| 2Q 2008 | 178.7 | 183.6 | -1.6% |
| 3Q 2008 | 181.4 | 184.6 | -1.1% |
| 4Q 2008 | 240.8 (186.6) | 186.6 | 0 |
| 1Q 2009 | 181.2 | 179.9 | -3.6% |
| 2Q 2009 | 171.4 | 176.2 | -5.6% |
| 3Q 2009 | 159.2 | 162.7 | -12.8% |
| 4Q 2009 | 201.4 (156.1) | 158.1 | - 15.3% |
| 1Q 2010 | 161.4 | 162.4 | - 13.0% |
| 2Q 2010 | 166.1 | 166.2 | - 10.9% |
| 3Q 2010 | 164.5 | 164.2 | - 12.0% |
| 4Q 2010 | 205.3 (159.1) | 159.4 | - 14.6% |
| 1Q 2011 | 168.7 | 167.8 | - 10.1% |
| 2Q 2011 | 178.8 | 175.6 | - 5.9% |
| 3Q 2011 | 180.2 | 174.6 | - 6.4% |
| 4Q 2011 | 226.0(175.2) | 167.8 | -10.1% |
| 1Q 2012 | 180.2 (p*) | 171.6 (p*) | -8.1%(p)* |
(p*=preliminary)
In summary, while in nominal terms state tax revenues have made back all but less than 4% of their entire shortfall off peak pre-recession revenues, measured in real terms they have stalled in the last several quarters. Meanwhile population has increased, and states have been facing record unemployment payouts. As I've said before, while there has been strong improvement, it still hasn't been enough.
Even worse, local governments, which rely on property taxes, are suffering from decreased revenues as well as decreased aid from the states.
If ECRI's prediction of another recession in the immediate future does turn out to be true, it is going to be brutal for state and local governments.
ISM Manufacturing and GDP
Yesterday, I wrote about the latest ISM manufacturing report. The above chart shows why I think this is an important data series. I've compared the ISM monthly index to the year over year percentage change in GDP. Notice that the data series follow each other pretty closely. It's not an exact match, but there is some similarity.
The above chart is the ISMs new orders index and the YOY percentage change in GDP. The relationship here is a bit weaker, although it still exists. For example, notice the big jump in new orders coming out of the 2000 recession that wasn't followed by a bug jump in GDP. However, the relationship did exist coming out of the early 1980s and 1990s recession.
The above chart is the ISM's production index relative to YOY GDP. Again, we see a general correlation.
The above charts indicate that the ISM is a decent, coincident indicator of GDP.
Morning Market
The SPYs price action over the last five days explains my concern about its supposed "break-out" from a consolidation pattern. Prices gapped higher and then moved higher for 2 and a half days. Prices broke trend on the third day of the rally and have been consolidating for the last two days between 125.5 and 127. While prices are still above the 200 minute EMA, this is a rally whose steam is running out.
Ideally, when prices break out from a consolidation pattern, we'd like to see long bars on high volume. Here we have the exact opposite -- weak bars on low volume. In addition,
We see the same pattern play out in the other averages -- prices broke out but did so on low volume. In addition, none of the bars are green, indicating prices closed higher at the close. As break-outs go, these are really terrible.
Oil prices continue to consolidate. Key prices levels to watch for are 102.75/103 and 96.
Tuesday, December 6, 2011
November housing roundup
; - by New Deal democrat
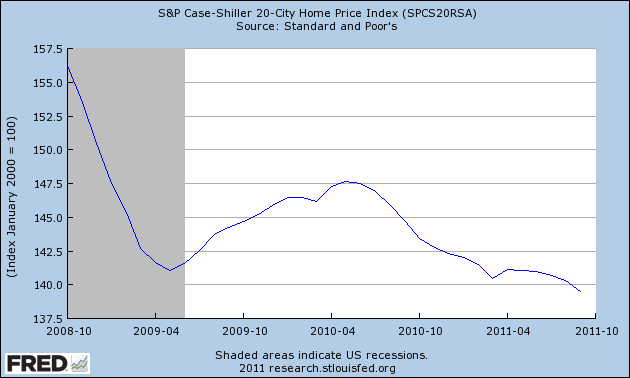
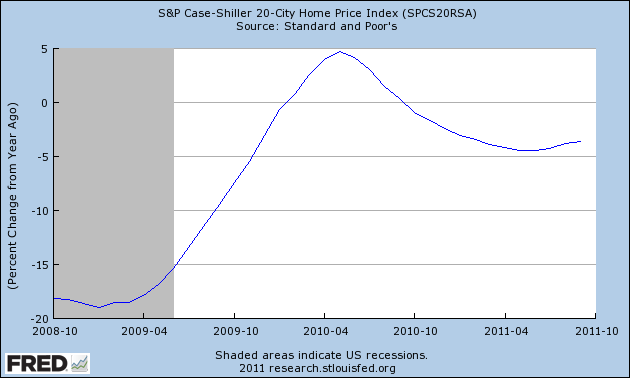
Two months ago I wrote that It's time to admit that house prices have stopped falling. November's housing price data rendered a split decision on that forecast, as asking prices from Housing Tracker confirmed a bottom, while data of repeat house sales in Case-Shiller contrarily did - finally - make a new low under their March 2011 level.
First, here is the 20 city Case Shiller index (from October 2008 to emphasize the post-crash reports, including the effects of the $8000 housing credit):

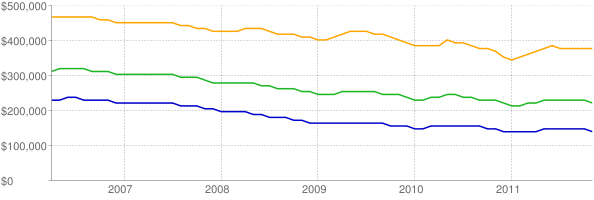
While the Case Shiller indexes report comparable sales prices, Housing Tracker reports asking prices in 54 metropolitan areas. I follow these because they showed the peak in the housing market at the beginning of 2006 before the Case Shiller sales prices did, and because since then they have led trend changes in the Case Shiller reports by about 4 to 6 months -- which makes sense, since houses are put on the market with asking prices months before they go under contract.
Comparing the Case Shiller graph above with this graph of asking prices for the 75th (yellow), 50th (green), and 25th (blue) percentiles for the last 5+ years at Housing Tracker shows that asking prices have been bottoming out for a year:

Indeed, Housing Tracker's data for all of November showed the YoY rate of declines on a monthly basis is now only -0.7% YoY. Here's the updated chart:
Housing Tracker's weekly YoY comparisons for November are instructive: in order, they were -0.9%, -0.5%, -0.3%, and +0.1%. December will tell, but it appears that the turning point has been reached.
Note that the YoY% decline in asking prices bottomed in January of this year. Case Shiller data shows that the change in YoY% decline in sales prices bottomed in May and June, and has been receding since, as shown in this graph:

Keep in mind that even after a nominal bottom in housing prices, there is likely to be an extended period where they are still declining in real, inflation-adjusted terms. Prof. Shiller himself believes another 15% or more decline in real terms is likely, and I do not have any reason to disagree with that.
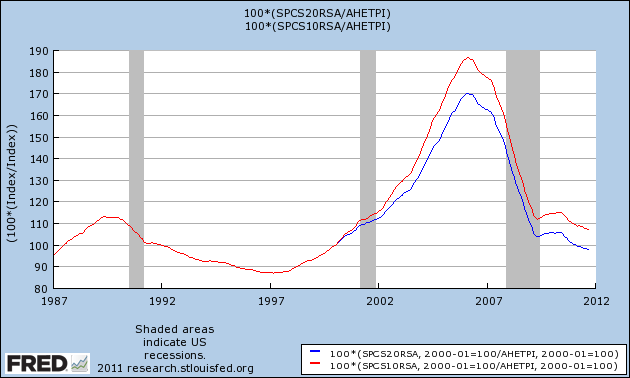
Indeed, adjusting the 10 and 20 city Case Shiller reports for average wages paid (where the beginning of the 20 city index in January 2000 = 100%), shows that in real terms, the average wage buys more house than at any point since that series began, and is only about 10% above the 10 city's average in the late 1980s and 1990s:

The discrepancy between the Case Shiller and Housing Tracker reports will get resolved one way or the other. I continue to expect Housing Tracker to be the leading series. In that regard, Bill McBride a/k/a Calculated Risk has noted that typically price inflection points are reached at about 6 months' housing supply -- more than that means declining prices ahead, less than that means rising prices ahead. As of the October housing sales reports, new home supply is at 6.3 months and has been declining at a rate of 2 months per year for the last several years. Existing home supply is at 8.0 months, and while the trend was distorted much more by the housing credit, recently inventory has been declining at a -10% YoY rate, which has also coincided with a rate of decline of 2 months' inventory per year. If those trends continue, then within a year both will be under 6.0 months and under CR's metric, we should expect housing prices to be increasing.
Two months ago I wrote that It's time to admit that house prices have stopped falling. November's housing price data rendered a split decision on that forecast, as asking prices from Housing Tracker confirmed a bottom, while data of repeat house sales in Case-Shiller contrarily did - finally - make a new low under their March 2011 level.
First, here is the 20 city Case Shiller index (from October 2008 to emphasize the post-crash reports, including the effects of the $8000 housing credit):

While the Case Shiller indexes report comparable sales prices, Housing Tracker reports asking prices in 54 metropolitan areas. I follow these because they showed the peak in the housing market at the beginning of 2006 before the Case Shiller sales prices did, and because since then they have led trend changes in the Case Shiller reports by about 4 to 6 months -- which makes sense, since houses are put on the market with asking prices months before they go under contract.
Comparing the Case Shiller graph above with this graph of asking prices for the 75th (yellow), 50th (green), and 25th (blue) percentiles for the last 5+ years at Housing Tracker shows that asking prices have been bottoming out for a year:

Indeed, Housing Tracker's data for all of November showed the YoY rate of declines on a monthly basis is now only -0.7% YoY. Here's the updated chart:
| Month | 2007 | 2008 | 2009 | 2010 | 2011 |
|---|---|---|---|---|---|
| January | --- | -7.5% | -11.5% | -5.8% | -8.7% |
| February | --- | -7.8% | -12.0% | -5.2% | -8.4% |
| March | --- | -8.3% | -10.9% | -5.0% | -7.3% |
| April | -2.7% | -8.6% | -9.6% | -5.0% | -6.8% |
| May | -3.5% | -9.1% | -8.1% | -5.0% | -5.6% |
| June | -5.0% | -9.8% | -7.0% | -5.0% | -4.4% |
| July | -5.4% | -10.4% | -6.1% | -5.1% | -4.2% |
| August | -6.0% | -10.6% | -5.5% | -6.1% | -2.8% |
| September | -6.2% | -11.1% | -5.1% | -6.6% | -1.7% |
| October | -6.7% | -11.4% | -4.5% | -7.0% | -0.9% |
| November | -6.6% | -11.7% | -4.5% | -6.7% | -0.7% |
| December | -7.2% | -11.4% | -5.6% | -7.8% | --- |
Housing Tracker's weekly YoY comparisons for November are instructive: in order, they were -0.9%, -0.5%, -0.3%, and +0.1%. December will tell, but it appears that the turning point has been reached.
Note that the YoY% decline in asking prices bottomed in January of this year. Case Shiller data shows that the change in YoY% decline in sales prices bottomed in May and June, and has been receding since, as shown in this graph:

Keep in mind that even after a nominal bottom in housing prices, there is likely to be an extended period where they are still declining in real, inflation-adjusted terms. Prof. Shiller himself believes another 15% or more decline in real terms is likely, and I do not have any reason to disagree with that.
Indeed, adjusting the 10 and 20 city Case Shiller reports for average wages paid (where the beginning of the 20 city index in January 2000 = 100%), shows that in real terms, the average wage buys more house than at any point since that series began, and is only about 10% above the 10 city's average in the late 1980s and 1990s:

The discrepancy between the Case Shiller and Housing Tracker reports will get resolved one way or the other. I continue to expect Housing Tracker to be the leading series. In that regard, Bill McBride a/k/a Calculated Risk has noted that typically price inflection points are reached at about 6 months' housing supply -- more than that means declining prices ahead, less than that means rising prices ahead. As of the October housing sales reports, new home supply is at 6.3 months and has been declining at a rate of 2 months per year for the last several years. Existing home supply is at 8.0 months, and while the trend was distorted much more by the housing credit, recently inventory has been declining at a -10% YoY rate, which has also coincided with a rate of decline of 2 months' inventory per year. If those trends continue, then within a year both will be under 6.0 months and under CR's metric, we should expect housing prices to be increasing.
ISM Manufacturing Show Continued Expansion
From the ISM Manufacturing Report:
There are a few odd points to mention. First, of 18 industries that are reporting growth, 9 are reporting a slowdown while 8 are reporting growth. In addition, five industries are reporting new orders growth while 6 are reporting slowing growth. This means that pace of growth in the expanding industries is higher than the pace of decline in the slowing industries.
Let's look at the anecdotal information:
Note that most of the information above is positive.
Let's coordinate the above data with the recently released Beige Book:
In short, manufacturing is holding its own. Let's take a look at the data in graph form:
Although the composite number dropped to just above 50, the latest reading gives us some "breathing room."
Although new orders are skewed (see above) the overall print is strong.
The overall production index is also shows a good print.
However, the employment number is still weak, although it does show slight expansion in this area as well.
"The PMI registered 52.7 percent, an increase of 1.9 percentage points from October's reading of 50.8 percent, indicating expansion in the manufacturing sector for the 28th consecutive month. The New Orders Index increased 4.3 percentage points from October to 56.7 percent, reflecting the second month of growth after three months of contraction. While the Prices Index, at 45 percent, increased 4 percentage points from the October reading of 41 percent, prices of raw materials continued to decrease (registering below 50 percent) for the second consecutive month. Respondents cite continuing concerns about the general economic environment, government regulations and European financial conditions, but are cautiously more optimistic about the next few months based on lower raw materials pricing and favorable levels of new orders."
There are a few odd points to mention. First, of 18 industries that are reporting growth, 9 are reporting a slowdown while 8 are reporting growth. In addition, five industries are reporting new orders growth while 6 are reporting slowing growth. This means that pace of growth in the expanding industries is higher than the pace of decline in the slowing industries.
Let's look at the anecdotal information:
"Business still holding its own. Some growth in margin now that some of the raw materials prices have abated. Oil is pushing $100 so that has not been favorable." (Chemical Products)
"Orders for the remaining two months have increased after an extended 'summer dip' in sales overall. We expect to finish the year approximately 10 percent above 2010." (Electrical Equipment, Appliances & Components)
"Seeing a slight slowdown in orders; could be related to the holidays." (Primary Metals)
"Material lead times are getting longer. Seems like no one is hiring. Trying to do twice the output with the same amount of people." (Food, Beverage & Tobacco Products)"Japanese auto production has returned to 100 percent, and domestic manufacturing continues to increase." (Fabricated Metal Products)
"Oil exploration seems to be really picking up. Government is permitting again, so business is the busiest we've ever seen." (Computer & Electronic Products)
"The EPS ruling about higher fees for coal-generated electricity can have a huge, negative impact on our business if implemented in January 2012. We are at the peak of our seasonal demand push." (Plastics & Rubber Products)
"Thailand flood impacting our business. Honda and Toyota cut production forecasts, and we are chasing some components made in Thailand." (Transportation Equipment)
Note that most of the information above is positive.
Let's coordinate the above data with the recently released Beige Book:
Manufacturing activity grew at a steady pace across most of the country, with all Districts other than St. Louis reporting increases in orders, shipments, or production. Chicago, St. Louis, and San Francisco reported positive results in metals and fabrication, while Cleveland saw flat steel production and Philadelphia noted decreased demand for primary metals. Cleveland and Chicago reported increased auto production year over year, but Boston noted signs of slower auto component production. Dallas saw steady demand for electronics, computers, and high-technology goods, but San Francisco reported that demand for consumer electronics continued to decrease. Philadelphia, Cleveland, and Chicago saw increased production of energy-related products. For construction-related goods, Chicago and Minneapolis reported declining demand, while Dallas said demand was stable. Overall, St. Louis saw more plant closures than plant openings or expansions. Freight transportation volumes increased in Cleveland, held steady in Atlanta and Kansas City, and were mixed in Dallas.
In short, manufacturing is holding its own. Let's take a look at the data in graph form:
Although the composite number dropped to just above 50, the latest reading gives us some "breathing room."
Although new orders are skewed (see above) the overall print is strong.
The overall production index is also shows a good print.
However, the employment number is still weak, although it does show slight expansion in this area as well.
No, Barry, Ratings Agencies Don't Matter
Over at the Big Picture, Barry asks a good question: do ratings agencies still matter?
No. Watch the bond and currency markets to see what the market really thinks.
Monday, December 5, 2011
Morning Market -- Consolidation Mania
The above charts are all the major indexes I track with the exception of oil. The treasury market, gold and the dollar are all clearly in a consolidation area and while the equity markets have technically "broken out," their respective break-outs are extremely weak, indicating they are probably false break-outs.
Remember, markets can move either vertically or horizontally. Ideally, we want them to move vertically because then we can make bets on the length and strength of the move. While we can still place bets (make trades) when prices move horizontally, it's a much harder game to plan.
So, what does all this mean? There are a few points:
1.) The fundamental news hasn't changed in a meaningful way over the last 6 months. The US economy is growing, bit slowly. Europe is just this side of a meltdown; Asia is still growing, but they are growing more and more cautious given the macro situation. In short, it's the same old song and dance. In short, the markets tell us we're in the middle of economic stasis, which we more or less are.
2.) At the same time, the markets currently tell us that safety is very important (the high price of treasuries), there is still inflationary concern (the high price of gold), the US is still weak (the low position of the dollar) and the US economic rebound is in question (US equities).
3.) There is also some end of the year portfolio management going on. Managers who had big gains are holding on to the last possible minute to sell to make sure they've locked in their gains for year.
The Going Nowhere Economy, Redux
From the latest Beige Book:
Overall growth was "slow to moderate." These are not the types of words you want to hear when describing your economy. Yet that's exactly where we've been for the last year -- stuck in slow growth.
Note the one thing that is missing from this report: real estate growth.
Overall economic activity increased at a slow to moderate pace since the previous report across all Federal Reserve Districts except St. Louis, which reported a decline in economic activity. District reports indicated that consumer spending rose modestly during the reporting period. Motor vehicle sales increased in a number of Districts, and tourism showed signs of strength. Business service activity was flat to higher since the previous report. Manufacturing activity expanded at a steady pace across most of the country. Overall bank lending increased slightly since the previous report, and home refinancing grew at a more rapid pace. Changes in credit standards and credit quality varied across Districts. Residential real estate activity generally remained sluggish, and commercial real estate activity remained lackluster across most of the nation. Single family home construction was weak and commercial construction was slow. Districts mostly reported favorable agricultural conditions. Activity in the energy and mining sectors increased since the previous report.
Hiring was generally subdued, although some firms with open positions reported difficulty finding qualified applicants. Wages and salaries remained stable across Districts. Overall price increases remained subdued, and some cost pressures were reported to have eased.
Overall growth was "slow to moderate." These are not the types of words you want to hear when describing your economy. Yet that's exactly where we've been for the last year -- stuck in slow growth.
Note the one thing that is missing from this report: real estate growth.
Notes on Friday's employment report: positive trends intact, actual good news in household survey
- by New Deal democrat
Friday's employment report continued the trends of employment as continued to initial jobless claims that were established in March 2009.
First of all, here is the updated graph comparing population-adjusted initial jobless claims with payrolls:

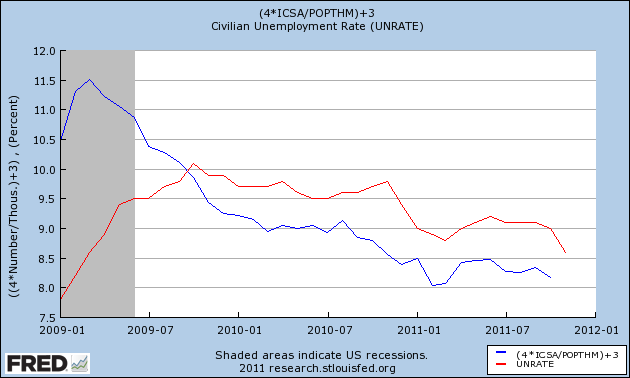
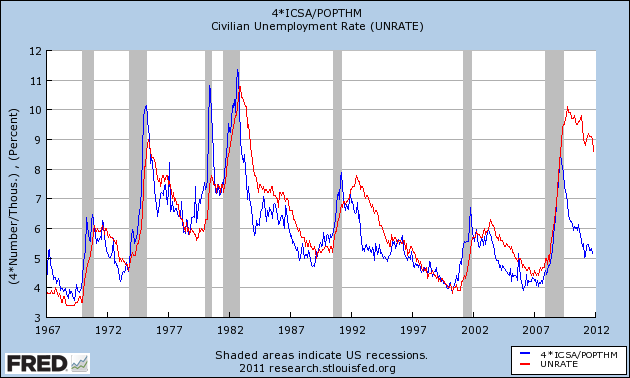
This relationship was historically very close beginning in 1967 but broke down in 2009. For the last two years, however, the new relationship established then has continued. A change in the population adjusted initial jobless claims rate is mirrored in the unemployment rate, frequently with a 1 or 2 month delay:

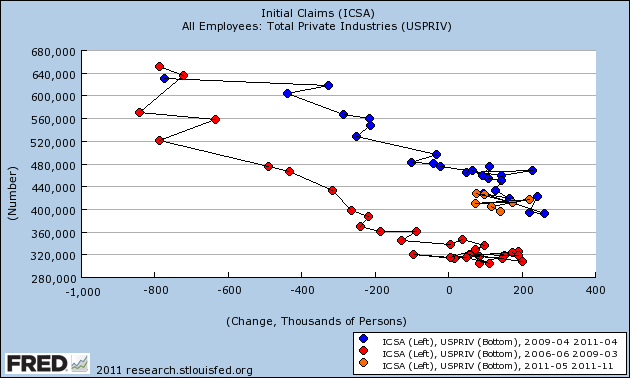
I've also noted that if we were to be heading towards a "double-dip," we should expect the relationship between the number of initial jobless claims and employment growth to change, whereby in the net many more jobs are lost per any given rate of initial claims. Although there may be some very slight drift in that direction since April (brown points), it hasn't happened in any meaningful way:

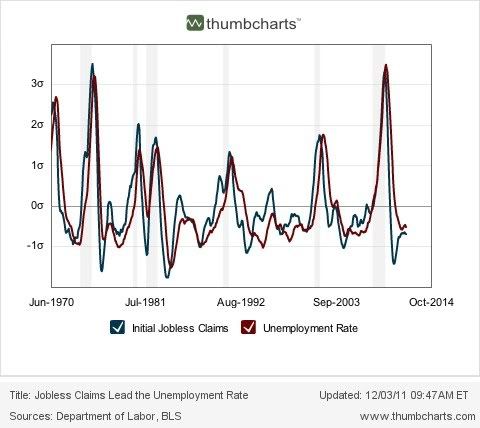
The longer term leading relationship of initial jobless claims to the unemployment rate (comparing the last 6 months' average with the average over the same six month period one year prior) as measured by Thumbcharts is also intact:

Finally, back in December 2009, Prof. Paul Krugman said:
Friday's employment report continued the trends of employment as continued to initial jobless claims that were established in March 2009.
First of all, here is the updated graph comparing population-adjusted initial jobless claims with payrolls:

This relationship was historically very close beginning in 1967 but broke down in 2009. For the last two years, however, the new relationship established then has continued. A change in the population adjusted initial jobless claims rate is mirrored in the unemployment rate, frequently with a 1 or 2 month delay:

I've also noted that if we were to be heading towards a "double-dip," we should expect the relationship between the number of initial jobless claims and employment growth to change, whereby in the net many more jobs are lost per any given rate of initial claims. Although there may be some very slight drift in that direction since April (brown points), it hasn't happened in any meaningful way:

The longer term leading relationship of initial jobless claims to the unemployment rate (comparing the last 6 months' average with the average over the same six month period one year prior) as measured by Thumbcharts is also intact:

Finally, back in December 2009, Prof. Paul Krugman said:
I thought it might be useful to create a sort of benchmark for the level of job growth that would really count as good news.…(emphasis mine)
[L]et’s set a … modest goal: return to more or less full employment in 5 years –which means seven lean years of depressed employment. To keep up with population growth over those 7 years, the United States would have had to add 84 times 127,000 or 10.668 million jobs. (If that sounds high, bear in mind that we added more than 20 million jobs over the 8 Clinton years). Add in the need to make up lost ground, and we’re at around 18 million jobs over the next five years — or 300,000 a month.
So that’s a useful benchmark.
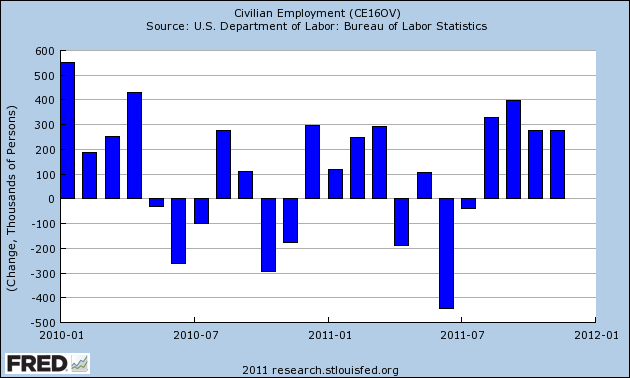
With that in mind, here's a graph of monthly gains in civilian employment from the Household Survey since its bottom:

No, it isn't the more generally reported Establishment Survey data, but the Household Survey does tend to lead at inflection points, and for the last 4 months, the average employment gain in the Household Survey has been 321,000/month, with the lowest being 277,000. I'm not nitpicking the Professor, but it's worth noting that this does meet Prof. Krugman's threshold criteria for actual good employment news.

No, it isn't the more generally reported Establishment Survey data, but the Household Survey does tend to lead at inflection points, and for the last 4 months, the average employment gain in the Household Survey has been 321,000/month, with the lowest being 277,000. I'm not nitpicking the Professor, but it's worth noting that this does meet Prof. Krugman's threshold criteria for actual good employment news.
Subscribe to:
Posts (Atom)