Two months ago I wrote that It's time to admit that house prices have stopped falling. November's housing price data rendered a split decision on that forecast, as asking prices from Housing Tracker confirmed a bottom, while data of repeat house sales in Case-Shiller contrarily did - finally - make a new low under their March 2011 level.
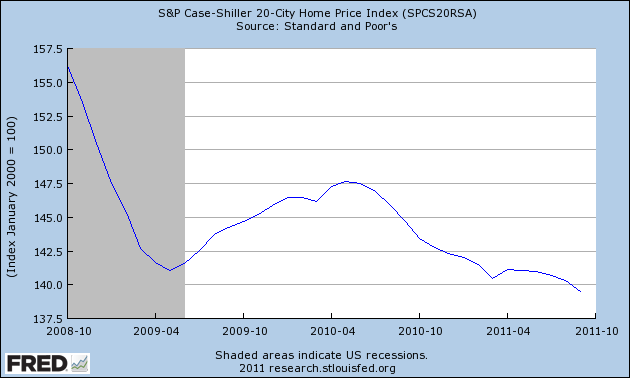
First, here is the 20 city Case Shiller index (from October 2008 to emphasize the post-crash reports, including the effects of the $8000 housing credit):
While the Case Shiller indexes report comparable sales prices, Housing Tracker reports asking prices in 54 metropolitan areas. I follow these because they showed the peak in the housing market at the beginning of 2006 before the Case Shiller sales prices did, and because since then they have led trend changes in the Case Shiller reports by about 4 to 6 months -- which makes sense, since houses are put on the market with asking prices months before they go under contract.
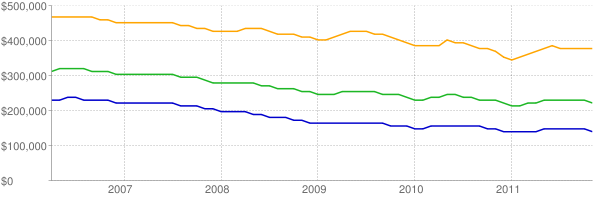
Comparing the Case Shiller graph above with this graph of asking prices for the 75th (yellow), 50th (green), and 25th (blue) percentiles for the last 5+ years at Housing Tracker shows that asking prices have been bottoming out for a year:
Indeed, Housing Tracker's data for all of November showed the YoY rate of declines on a monthly basis is now only -0.7% YoY. Here's the updated chart:
| Month | 2007 | 2008 | 2009 | 2010 | 2011 |
|---|---|---|---|---|---|
| January | --- | -7.5% | -11.5% | -5.8% | -8.7% |
| February | --- | -7.8% | -12.0% | -5.2% | -8.4% |
| March | --- | -8.3% | -10.9% | -5.0% | -7.3% |
| April | -2.7% | -8.6% | -9.6% | -5.0% | -6.8% |
| May | -3.5% | -9.1% | -8.1% | -5.0% | -5.6% |
| June | -5.0% | -9.8% | -7.0% | -5.0% | -4.4% |
| July | -5.4% | -10.4% | -6.1% | -5.1% | -4.2% |
| August | -6.0% | -10.6% | -5.5% | -6.1% | -2.8% |
| September | -6.2% | -11.1% | -5.1% | -6.6% | -1.7% |
| October | -6.7% | -11.4% | -4.5% | -7.0% | -0.9% |
| November | -6.6% | -11.7% | -4.5% | -6.7% | -0.7% |
| December | -7.2% | -11.4% | -5.6% | -7.8% | --- |
Housing Tracker's weekly YoY comparisons for November are instructive: in order, they were -0.9%, -0.5%, -0.3%, and +0.1%. December will tell, but it appears that the turning point has been reached.
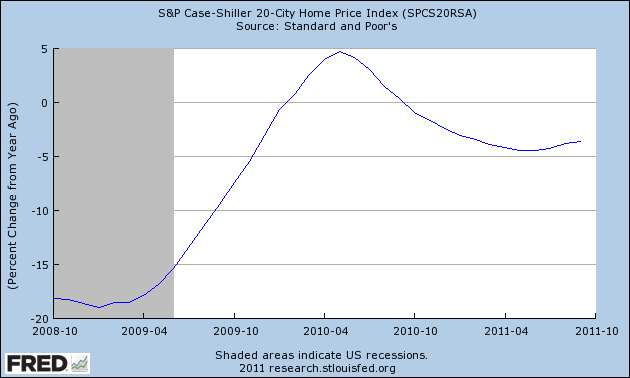
Note that the YoY% decline in asking prices bottomed in January of this year. Case Shiller data shows that the change in YoY% decline in sales prices bottomed in May and June, and has been receding since, as shown in this graph:
Keep in mind that even after a nominal bottom in housing prices, there is likely to be an extended period where they are still declining in real, inflation-adjusted terms. Prof. Shiller himself believes another 15% or more decline in real terms is likely, and I do not have any reason to disagree with that.
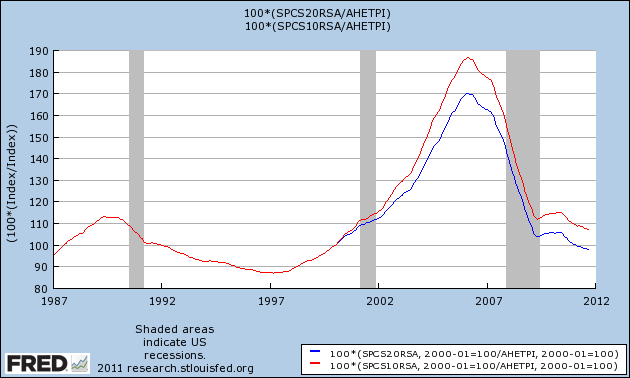
Indeed, adjusting the 10 and 20 city Case Shiller reports for average wages paid (where the beginning of the 20 city index in January 2000 = 100%), shows that in real terms, the average wage buys more house than at any point since that series began, and is only about 10% above the 10 city's average in the late 1980s and 1990s:
The discrepancy between the Case Shiller and Housing Tracker reports will get resolved one way or the other. I continue to expect Housing Tracker to be the leading series. In that regard, Bill McBride a/k/a Calculated Risk has noted that typically price inflection points are reached at about 6 months' housing supply -- more than that means declining prices ahead, less than that means rising prices ahead. As of the October housing sales reports, new home supply is at 6.3 months and has been declining at a rate of 2 months per year for the last several years. Existing home supply is at 8.0 months, and while the trend was distorted much more by the housing credit, recently inventory has been declining at a -10% YoY rate, which has also coincided with a rate of decline of 2 months' inventory per year. If those trends continue, then within a year both will be under 6.0 months and under CR's metric, we should expect housing prices to be increasing.