Showing posts with label Mish. Show all posts

Thursday, December 8, 2011

The WSJ misleads, Mish misreads temporary employment data

- by New Deal democrat

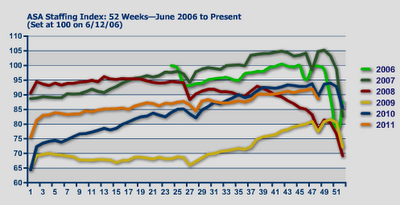
This morning the WSJ has an article entitled Demand for Temp Help Cools including a graph of the YoY% change in the American Staffing Association index. This note was picked up by Mish, who furthers the analysis by including the American Staffing Association's graph of its staffing index beginning July 1, 2006, highlighting that the index has been lower YoY since mid-August.

Since this index is a component of my "Weekly Indictors" needless to say I am familiar with this data. While the data cited by both is accurate, the interpretation is misleading in the case of the WSJ, and Mish misreads it.

To begin with, temporary hiring is indeed a leading component of employment data, tending to both peak and trough before overall employment. To cut to the chase, here is the graph of temp hiring from the BLS employment report for the last 10 years:
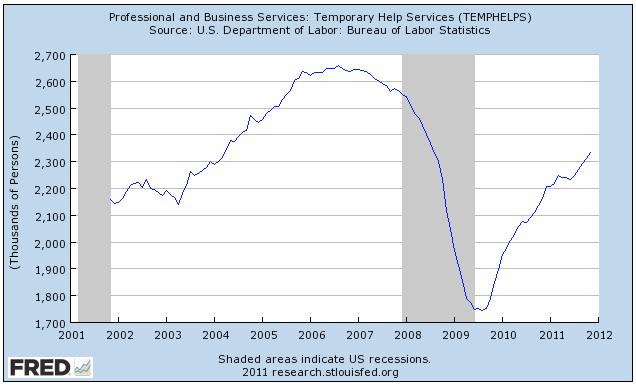


Note that temp hiring peaked about 18 months before the recession began, and bottomed in late 2009 about 6 months before the bottom in employment generally. Secondly, note that this number briefly declined earlier this year and has since resumed its strong advance.

Simply put, temporary help in no way supports a claim that we are on the cusp of recession.

What is wrong with the WSJ analysis shows the shortcomings of relying on YoY comparisons. Because of seasonality, sometimes there is no choice but to do so, but in that case, you have to be mindful of the second derivative as well: are the YoY comparisons getting better or worse? Beginning in about March of this year, the YoY comparisons even while still positive began to deteriorate significantly. The YoY comparisons were at their worst at about the beginning of September, and since then have improved, even though they are still slightly negative YoY. This is easily seen on the ASA's graph of their employment index as reposted by Mish, which also shows that the raw ASA index number stalled in early summer, and since the beginning of autumn has resumed its improvement (as I have duly reported each week in my "Weekly Indicators" column):


Mish says:
Since week 33 (mid-August), demand for temporary and contract help is below where it was for the same week in 2010. Although 2011 is substantially better than 2008 and 2009, it is now lagging 2010 and considerably lagging 2006 and 2007.

... [C]onsider the possibility employers are slowly dumping temps and contract workers, and permanent employees may be next.

Mish's analysis would have been spot on a few months ago during the summer employment stall, but is no longer true. Just as the ASA index's late 2009, 2010 and early 2011 readings were also "lagging 2006 and 2007", but still improving, meaning that temp services were increasing, so now even though November's readings were slightly below last November's readings, the index is increasing again, and indeed the YoY comparisons, while still negative, are slowly improving as well.

To repeat: the ASA temp service index is simply not now signaling a recession.

Bonddad here:

A long time ago in a galaxy far, far away, Mish did some great work.  And he's still capable of doing that work.  However, at some point in the last few years he because drunk with success and enthralled with his own political agenda.  At this point, he became utterly useless as an economic analyst. 

Thursday, October 14, 2010

Mish vs. ECRI vs. Krugman one year later: One helping of crow for Prof. Krugman?

- by New Deal democrat

As Barry Ritholtz pointed out at the time, exactly one year ago today a very specific intellectual challenge was made. It started with Mish strongly challenging ECRI's record of predicting recessions.

Subsequently, Prof. Paul Krugman wrote:
Michael Shedlock has an awesome takedown of ECRI’s claim that its indicators (a) have successfully predicted turning points in the past (b) point to a sold recovery now. I’d add that this is a really, really bad time to be relying on conventional indicators.

Why? Basically, because in a zero-interest rate world — the three-month rate was .066% last I looked — especially one that’s suffered from a collapse of the shadow banking system, conventional indicators don’t mean what they usually mean. Increases in the monetary base aren’t especially expansionary. The yield curve more or less has to slope up, even if no recovery is expected. And so on.

So historical correlations, to the extent that they exist — and as Shedlock points out, ECRI is claiming a much better record than it really has — can’t be counted on to prevail. There’s really no alternative to making fundamental analyses of the macro situation.
Lakshman Achuthan of ECRI responded with a very specific challenge:
we fully expect the current economic recovery to prove to be stronger than the last two, at least through mid-2010....

While we don’t necessarily expect our clarifications to change your views about the near-term course of the business cycle, we would hope that if, a year from now, ECRI’s leading indexes are proven to have been correct, you would publicly acknowledge the same. After all, the proof is in the pudding.
It is exactly one year later today. So, was "the current economic recovery stronger than the last two, at least through mid-2010?" The data is in, and we have an answer.

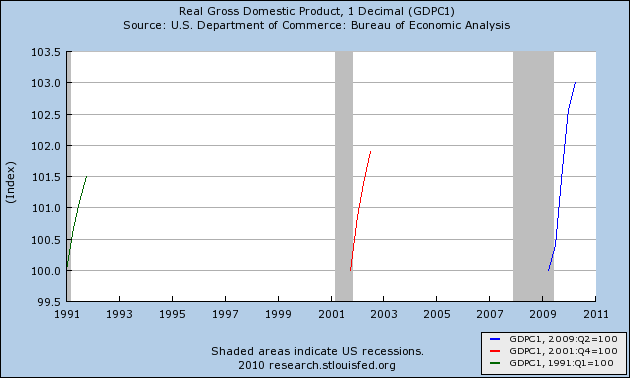
To judge the issue, I am relying on the indicators chosen by the NBER to gauge the end of recessions: GDP, Industrial Production, Real retail sales, Nonfarm payrolls, Aggregate hours worked, and Real income. As of June 30 of this year, here is how they stacked up against the last two recoveries:

Here is real GDP:


This is no contest. Judging based on 12 months from the end of the 3 recessions as decided by the NBER, the year between June 30, 2009 and June 30, 2010 showed the strongest GDP growth.

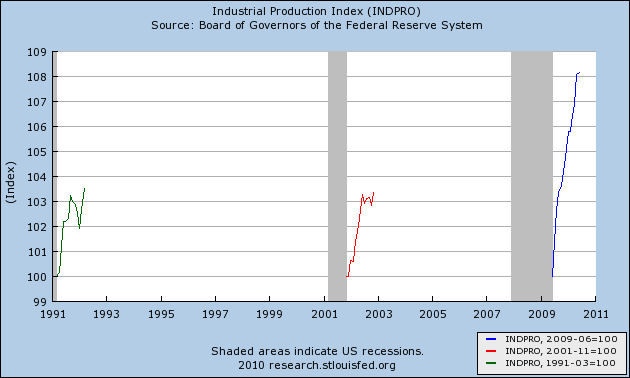
There is also no contest when it comes to the first 12 months after the recession bottom as to Industrial Production:


The same is true of real retail sales:


Perhaps surprisingly, aggregate hours worked also improved more strongly in the twelve months between June 30, 2009 and June 30, 2010 in comparison with the last two recoveries:


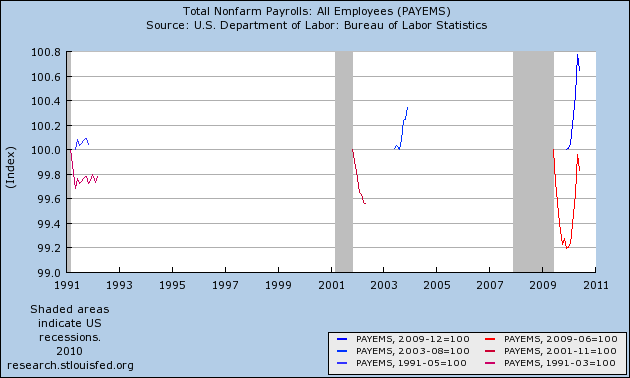
But the biggest surprise of all is the one measured by nonfarm payrolls. In the graph below, the blue line measures payrolls growth for a period of 6 months from the lowest post-recession reading of the "jobless" recoveries (most recently, December 2009 through June 2010). The red line, by contrast, measures job growth (or not) in the twelve months since the official NBER bottom:


I expected the two different modes of measurement to yield very different results. Instead, either way, the present recovery through June 30, 2010 has been stronger for jobs than either of the last two.

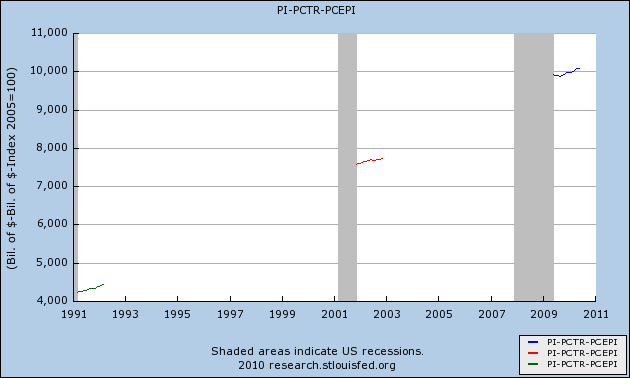
Finally, here is real income:


Although it is difficult to tell from the graph, real income was stronger in the first year of the recovery from the 1990 recession than at present.

That makes the final score: ECRI 5, Krugman 1.

So, will Prof. Krugman publicly acknowledge, as requested by ECRI last year, that their forecast was correct, and that contrary to his assertion then, "There[ ] really [is an] alternative to making fundamental analyses of the macro situation?"