Thursday, November 19, 2009

Business As Usual: Make Stuff Up

During Tim Geithner's somewhat contentious appearance before Congress today, some Republicans took every opportunity to get their shots in. Congressman Michael Burgess (Asshat-TX), was no exception. He got his sound bite in -- "I don't think you should be fired, I think you never should have been hired," or something to that effect. Whatever, he's entitled to his opinions, but not his own facts.

It's what the Congressman said immediately before that that intrigues me, as he and Geithner duelled on the merits of different economic policies, Burgess being all about "cut taxes and get out of the way." He said, and I quote:

“When I came here in 2003 we were in a jobless recovery. Tax relief was passed in May of 2003 and as a consequence, by July of that year we were adding jobs at a significant [ed. note: he stresses "significant"] rate. It [referring to tax relief] seems to have worked fairly well.”

Watch it here at 3:57 into the video.

Well, if by "significant" he means a 25,000 add in July 2003 followed by a
-42,000 loss in August, then he's on to something. Otherwise, he's just a lying sack of shit (whose office was oddly unable to answer my simple question as to what the hell he was talking about):

Business as usual: Just make stuff up.

P.S. Congressman, if you're out there, just drop your response in the comments section.

Today's Market

I've spent a fair amount of time explaining why I don't like the current market. This is another post along those lines.

Click for a larger image


A.) On November 9 prices gapped higher, printing a strong bar. That's the kind of event bulls like.

B.) The prices clustered in a very narrow range, printing three very weak candles. This is a terrible way to follow-through from a strong up day.

C.) Prices can't gtet above the 111 level in a meaningful way. They try but just can't get above the level with any momentum. This is followed by today's action which was a sell-off.

The EMA picture is still bullish. But notice that prices just aren't moving higher with any conviction. Combine with with the weak performance by the Tranports and microcaps and I'm just not impressed.

Housing Starts Drop

From the Census:

Privately-owned housing starts in October were at a seasonally adjusted annual rate of 529,000. This is 10.6 percent (±8.7%) below the revised September estimate of 592,000 and is 30.7 percent (±8.3%) below the October 2008 rate of 763,000.


However, let's put that number in visual perspective:


Click for a larger image

The total annual pace of housing starts (1 unit) has been between 476,000 -511,000 for the last five months. So far, that looks like a low-level range. In addition,


Click for a larger image

Total starts have been in a roughly 100,000 unit range for 10 months.

Right now, it looks like we're bottoming.

October Leading Indicators

As I predicted a couple of weeks ago, October Leading Economic Indicators (and revisions to September) came in at +0.3, the seventh positive reading in a row. This suggests that economic growth will continue through this quarter and the first quarter of 2010 as well.

To repeat what I said then: typically, even in the last two "jobless recoveries", jobs began to be added to the economy when the YoY LEI was up +5% or better. This month will replace the awful -1% of October 2008, meaning that for the last 7 months, the LEI is up 5.9%, and up 4.2% YoY. If the LEI simply print flat for November and December, the YoY growth will be +5.0%, consistent with jobs being added in December or January.

In view of this week's poor housing permits number, that should prove interesting.

Sage Wisdom For Investing -- In Anything

I oft mention David Rosenberg, and he oft mentions one of the wisest men on Wall St., Bob Farrell. Farrell is a legendary, Hall of Fame market maven and technician who plied his trade for decades at Merrill Lynch. When he left (he still writes a subscription-only newsletter), he penned his Market Rules to Remember, which I'd posted a long while ago over at Blah3 and will share with the Bonddad crowd now. These rules are truly timeless, and applicable to investing in just about anything. Without further ado:

1) Markets tend to return to the mean over time.
2) Excesses in one direction will lead to an opposite excess in the other direction.
3) There are no new eras -- excesses are never permanent.
4) Exponential rapidly rising or falling markets usually go further than you think, but they do not correct by going sideways.
5) The public buys the most at the top and the least at the bottom.
6) Fear and greed are stronger than long-term resolve.
7) Markets are strongest when they are broad and weakest when they narrow to a handful of blue chip names.
8) Bear markets have three stages -- sharp down, reflexive rebound, and a drawn-out fundamental downtrend.
9) When all the experts and forecasts agree -- something else is going to happen.
10) Bull markets are more fun than bear markets.

Print them out and keep them handy. You'll be glad you did.

Intial Jobless Claims: 505,000

The BLS reported that for the week ending Nov. 14, seasonally adjusted initial jobless claims were 505,000. Last week's number was revised slightly higher to 505,000 as well.

"The 4-week moving average was 514,000, a decrease of 6,500 from the previous week's revised average of 520,500."

Unadjusted, there were 479,295 new claims, a decrease of 53,132 from the week before, and well below the 513,000 initial claims in the same week last year.

In unadjusted terms, this was the best new claims number, relative to normal seasonal adjustment, in over a year. The 4 week moving average is now about 21% lower than the peak of 658,750 on April 3 of this year. Needless to say, the continuing decline in the number of new claims bodes well for the jobs outlook.

Thursday Oil Market Round-Up


A.) Prices are still contained by a trend line

B.) The EMA picture is still bullish -- the shorter EMAs are above the longer EMAs. But also notice the 10 day EMA is more or less horizontal, indicating a flat line short term trend. The longer terms trends (20 and 50 day EMAs) are still positive. Finally, note that on several times over the last few weeks prices have used the 200 day EMA as technical support.


A.) Momentum is decreasing but not crashing. This is standard in a consolidation pattern.

B.) The A/D line is still positive, indicating we have not seen a huge outflow of money from the market.

Wednesday, November 18, 2009

Today's Market


Yes, the SPYs are rallying. BUT

A.) Notice that prices have not been able to get above 111.50. Also note the candles are getting smaller. And

B.) There is low volume. If people are so excited about this market then they should be stampeding into the market, thereby increasing volume.


And if the market is so strong, why aren't the Transports confirming the rally?


A.) Or the microcaps -- which are still hitting resistance at the EMAs.

This is not a broad rally which is very disconcerting.

Congress and White House Look At Jobs Bill

From the NY Times:

With Congressional Democrats in near-panic amid forecasts that unemployment will remain high through next November’s midterm elections, a party leader said on Thursday that the House will pass a new “jobs bill” before Dec. 18.

Senate Democrats likewise are weighing options. And the signals from Congress follow by a day the White House’s announcement that President Obama will follow his “Forum on Jobs and Economic Growth” on Dec. 3 with a “Main Street Tour” starting the next day in Allentown, Pa., and continuing to other hard-hit places in coming months.

With more than half of last winter’s $787 billion package of tax cuts and stimulus spending still in the pipeline, Representative Steny H. Hoyer, the Democratic majority leader from Maryland, said the new measure should not be called another stimulus bill.

“I don’t want it to be as broad as that,” he said. “I want it to be very targeted on jobs.”

He indicated that the legislation might include money for public jobs, which many liberals have advocated; tax credits to employers for new hires, an Obama campaign proposal that was shelved early this year amid concern that businesses might game their payrolls; and additional spending for infrastructure and road projects.

First, this is an overall good idea. With unemployment at 10.2% every little bit helps.

But it's also important to remember exactly what has happened in the economy and where we are in the cycle to understand exactly what is going on. And no -- the following is not an endorsement of bad times; it is simply an explanation of the facts without a judgment attached.

At the end of last year and the beginning of this year the US was losing jobs at a rate of 600,000/month. That lasted for 5 months. Or to put it another way, the US lost 3 million jobs in 5 months. That is almost half of all the jobs created during the last expansion. That tells us the severity of the economic situation was indeed severe. Employers simply cut everybody they could and then some. In addition, we have also learned that the BLS has added an additional 800,000 jobs losses to the official job loss total. These will be added in February. This further indicates we were in an extremely severe economic contraction.

Currently the economy is back from the brink. We printed a solid GDP number last quarter and the rate of job losses continues to decrease. In addition, the pace of initial unemployment claims continues to move lower. All of these facts tell us we're moving in the right direction. BUT -- and this is very important -- remember where we were last year at this time. There were a lot of people talking about depressions and deflationary spirals. These are the most severe economic events we can experience. The repercussions of these events last a long time.

Does this statement imply that I am unsympathetic to the unemployed? No. I have never advocated (and will never advocate) that we decrease or cut off unemployment benefits or show any less sympathy for those who have lost their jobs. That is not the point of the above recitation of historical facts. The point is things are moving in the right direction. Recoveries -- especially from near financial collapses -- don't happen overnight. As the article states we've only just started to use the stimulus money. We've just printed our first quarter of positive GDP growth. By this time next year things should be better.


October CPI: the end of the Deflationary Bust

- by New Deal democrat

This morning's CPI came it at +0.3%, slightly higher than estimates. YoY CPI is -0.2%. This is undoubtedly the swan song for deflation this year. Almost certainly we will find that this month prices increased about 2.0% YoY.

All things considered, that's a good thing. Here's a graph showing YoY inflation for consumers (blue), finished goods (red), and commodities (green):


When all three are rising, green more than red more than blue, that's bad and almost always triggers a recession (always in the presence of an inverted yield curve 1 year previously). That's because price pressures in crude goods can't be passed on to producers, who in turn can't turn them on to consumers, so there are cutbacks, triggering a recession. All three then proceed to fall, as demand slackens.

When demand hits bottom, crude increases can be passed on to producers with room to spare (so profits increase), and similarly producers can pass on increases to consumers. Increased demand and increased profits lead to economic expansion and hiring new employees. (Graphically this means all three lines rising, with blue higher than red higher than green.)

As I have repeastedly noted, this was also true of the Great Depression and the 1920's booms and busts.

In short, the K.I.S.S. signal -- a positive yield curve, a rising rate of price changes, and cpi exceeding ppi -- together with the positive LEI of the last few months, indicate the economy will show growth for the 4th quarter.

A Positive Economist

FYI: there are people who see positive things in the economy. (I realize he's probably just a corporate shill who is relying on compromised data, but anyway...)

Wednesday Commodities Round-Up


A.) Prices consolidated in a triangle pattern from roughly mid-October to mid-November.

B.) Prices moved out of this price range by gapping higher and printing a very strong candle. Also notice the volume surge that took place.

Also note that prices are still above the long-term trend line. Finally, we still have a very bullish EMA orientation -- the shorter EMAs are above the longer EMAs, all the EMAs are moving higher and prices are above all the EMAs.


A.) Like copper, agricultural commodities formed a triangle consolidation pattern from roughly mid-October to mid-November.

B.) Price broke out of this pattern yesterday by printing a strong bar on high volume.

The EMA picture is a bit more muddled. Prices have been coalescing around the 200 day EMA and the shorter EMAs are below the 200 day EMA. In addition, notice the EMAs are in a tight range. Ideally in a bull market we'd like to see a more bullish orientation for the EMAs.

Tuesday, November 17, 2009

Today's Market


A.) The QQQQs may be forming a broadening top formation.

B.) but the EMA picture is still very strong -- the shorter EMAs are above the longer EMAs, all the EMAs are rising and prices are above all the EMAs.

C.) Momentum was leaving the index, but

D.) We've seen a recent increase in overall momentum and

E.) If we're really topping out, why aren't we seeing money flow out of the market? Instead, we're seeing the A/D line hold steady.

Empire State and Retail Sales Recap

From the NY Federal Reserve:

The Empire State Manufacturing Survey indicates that conditions for New York manufacturers improved in November, but at a somewhat slower pace than in October. The general business conditions index fell 11 points, to 23.5. The indexes for new orders and shipments posted similar declines. Pricing pressures eased, with the prices paid index positive but lower than last month and the prices received index rising to a level just below zero. Employment indexes fell from October’s elevated levels, remaining slightly positive. Future indexes conveyed an expectation that activity and employment would improve in the months ahead and that both input and selling prices would increase significantly.


Here is the relevant chart:


Notice the index is currently at levels associated with expansion. Also note the index has rebounded from the extremely low levels we saw earlier this year. SilverOz has noted that part of most statistical rebounds we are seeing is due to the extreme readings we saw earlier this year; that is, part of what we are seeing is a standard rebound. I think that's accurate. The economy literally hit the brakes at the end of last year/beginning of this year. However, I think there are continuing signs the economy is recovering. Here are additional charts from the report:


Notice the overall trend for both overall business and new orders is positive.

Also note the employment component of the report is also getting better.

Retail Sales Increase:

From the Census Bureau:

The U.S. Census Bureau announced today that advance estimates of U.S. retail and food services sales for October, adjusted for seasonal variation and holiday and trading-day differences, but not for price changes, were $347.5 billion, an increase of 1.4 percent (±0.5%) from the previous month, but 1.7 percent (±0.5%) below October 2008. Total sales for the August through October 2009 period were up 1.5 percent (±0.3%) from the same period a year ago. The August to September 2009 percent change was revised from -1.5 percent (±0.5%) to -2.3 percent (±0.3%).


Here are some very important observations:

Excluding the 7.4% increase in auto sales, retail sales rose 0.2% in October, the data showed. Sales excluding autos have risen for three months in a row and in five of the past six months.


Simply put, sales are moving in the right direction. Also note the alot of the increase was car sales - in a post cash for clunkers world. That tells us there is still demand for autos out there without government stimulus.

Here is the relevant chart:


A while ago I noted that we can look at the recent data in the following way:

A.) The complete contraction in any spending and

B.) The recovery where the pace of month over month percentage changes returned to more normal levels. That appears to be where we are now.

Short version, both of these pieces of data are positive.

Industrial Expansion, Services Stagnation (and Weekly Indicators)

- by New Deal democrat

The release of October retail sales yesterday and industrial production this morning make for interesting bookends to the economic situation.

This morning Industrial Production for October was reported up a mere 0.1%. Capacity utilization was reported up 0.2%. I tend to ignore the latter number, since it generally tracks the former, and capacity utilization has been in decline literally for decades, reflecting America’s relative industrial decline. Industrial production, however, is an excellent coincident indicator for industrial growth or weakness. Whether October's meager increase means a slowing down of the trend of expansion, or is just one month's noise, is impossible to tell. In any event, this means that since its bottom at the end of the second quarter, industrial production has grown 2.9% in four months (or about 12% a year), which is the best rebound from a recession trough since 1982. In other words, so far manufacturing is having a V-shaped recovery.

On the other hand, while yesterday’s retail sales figures appeared great at first blush, up +1.4% from September and topping estimates substantially, the downside was the very nasty revisions to August and September. August was revised down from +2.7 to +2.2. September was revised down from -1.5 to -2.3. In other words, those two months together went from +1.2 to -0.1. The efficacy of “cash-for-clunkers” as anything other than a momentary blip appears to have been entirely revised away. Ouch! Thus September may have actually made a new low in real retail sales for the recession. Over the longer term, since April, real retail will be about +0.8 instead of +2.0 as it may have otherwise appeared. The services economy isn’t having a V-shaped recovery; in fact it is barely having a recovery at all.

The above contrast fits perfectly with the ISM manufacturing and non-manufacturing data. Manufacturing moved into expansion first, and is already expanding faster than it has coming out either post-1982 recession. Non-manufacturing, however, is barely expanding at all. Employment in manufacturing has already started to increase, according to the ISM manufacturing report, but employment in services is continuing to fall, and actually fell off at a worse rate last month. This analysis also seems to dovetail well with Invictus’ take on the divergence between large vs. small employers. I’ll have more to say about this divergence in an extended post in a couple of days.

So we have two bookends for the economy: industrial expansion, services stagnation. The recovery from the recession is all about selling goods to foreign consumers, chiefly Asians, whose standard of living is improving. On the other hand, the American consumer is no longer the engine of global growth, but the caboose. His/her standard of living is in decline, and will only turn around when the structural forces which led to that decline have been abated.

One final note: the October growth in retail sales was not surprising, if you’ve been following my “Weekly Indicators” each Friday. I have been tracking these items precisely because they give high volume real-time information. So when automakers reported sales up 10% from September to October, and when the ICSC reported ever-improving week over week sales followed by good monthly same store sales for October, it appeared likely that the retail sales number would oblige, and it did.

From Bonddad:

From the NY Federal Reserve:

The Empire State Manufacturing Survey indicates that conditions for New York manufacturers improved in November, but at a somewhat slower pace than in October. The general business conditions index fell 11 points, to 23.5. The indexes for new orders and shipments posted similar declines. Pricing pressures eased, with the prices paid index positive but lower than last month and the prices received index rising to a level just below zero. Employment indexes fell from October’s elevated levels, remaining slightly positive. Future indexes conveyed an expectation that activity and employment would improve in the months ahead and that both input and selling prices would increase significantly.


Here is the relevant chart:


Notice the index is currently at levels associated with expansion. Also note the index has rebounded from the extremely low levels we saw earlier this year. SilverOz has noted that part of most statistical rebounds we are seeing is due to the extreme readings we saw earlier this year; that is, part of what we are seeing is a standard rebound. I think that's accurate. The economy literally hit the brakes at the end of last year/beginning of this year. However, I think there are continuing signs the economy is recovering. Here are additional charts from the report:


Notice the overall trend for both overall business and new orders is positive.

Also note the employment component of the report is also getting better.

Retail Sales Increase:

From the Census Bureau:

The U.S. Census Bureau announced today that advance estimates of U.S. retail and food services sales for October, adjusted for seasonal variation and holiday and trading-day differences, but not for price changes, were $347.5 billion, an increase of 1.4 percent (±0.5%) from the previous month, but 1.7 percent (±0.5%) below October 2008. Total sales for the August through October 2009 period were up 1.5 percent (±0.3%) from the same period a year ago. The August to September 2009 percent change was revised from -1.5 percent (±0.5%) to -2.3 percent (±0.3%).


Here are some very important observations:

Excluding the 7.4% increase in auto sales, retail sales rose 0.2% in October, the data showed. Sales excluding autos have risen for three months in a row and in five of the past six months.


Simply put, sales are moving in the right direction. Also note the alot of the increase was car sales - in a post cash for clunkers world. That tells us there is still demand for autos out there without government stimulus.

Here is the relevant chart:


A while ago I noted that we can look at the recent data in the following way:

A.) The complete contraction in any spending and

B.) The recovery where the pace of month over month percentage changes returned to more normal levels. That appears to be where we are now.

Short version, both of these pieces of data are positive.

Could Unemployment Breach 12%? 13%?

Economist David Rosenberg made some news last week on Bloomberg's Surveillance when he speculated that the unemployment rate in the United States could hit between 12 - 13%, higher than most economists are currently projecting and clearly an outlier forecast. I'm not entirely sure why the call is apparently so controversial.

Among the things that Rosie looked at in doing his analysis is the so-called Under-employment Rate (U-6) minus the Unemployment Rate. A chart of that difference looks like this:

The average difference between the two is just over 4%; it's currently a record 7.3% (17.5 - 10.2). (U-6 is only available since 1994.) Now, we can get back to the long-term average many ways, but it's certainly not out of the realm of possibility that one way we'll do so is to see unemployment at 12% while the U-6 drifts back down toward 16%. Would anyone consider that possibility crazy?

On a related note, continuing to add to the file on the plight of small businesses, I came across the following information over the weekend as to their importance to our economy:

Small firms (<500)
• Represent 99.7 percent of all employer firms.
• Employ just over half of all private sector employees.
• Pay 44 percent of total U.S. private payroll.
• Create more than half of the nonfarm private gross domestic product (GDP).
• Hire 40 percent of high tech workers (such as scientists, engineers, and computer programmers).
• Are 52 percent home-based and 2 percent franchises.
• Made up 97.3 percent of all identified exporters and produced 30.2 percent of the known export value in FY 2007.
• Produce 13 times more patents per employee than large patenting firms; these patents are twice as likely as large firm patents to be among the one percent most cited.

And, perhaps most importantly:

Firms with fewer than 500 employees accounted for 64 percent (or 14.5 million) of the 22.5 million net new jobs (gains minus losses) between 1993 and the third quarter of 2008.

This is the group that, according to the NFIB's monthly SBET [.pdf], is simply not seeing much light at the end of the tunnel. So the question needs to be asked: When the NFIB reports that the country's "job generating machine is still in reverse," and we know that its member firms account for ~64% of net new job creation, how are we going to achieve sufficient job creation to make a meaningful dent in the un- and under- employment rates before Rosie's forecast comes to pass?

Here's what the SBET survey looks like with regard to Hiring Plans:


So, hiring plans for small business are, in fact, incrementally worse now than they were one year ago (-1 vs. 0). There's no more inclination on the part of this business cohort to add employees now than there was one year ago, and in that period the unemployment rate has increased dramatically. Makes Rosie's forecast seem fairly uncontroversial to me.

Treasury Tuesdays

All charts are of the IEF -- the 7-10 year Treasury ETF.

Click on all charts for a larger image.


In general, the IEFs were in a downward sloping flag pattern for the last ~month. Also notice the lack of overall firm direction over the last 6 months; there is no firm trend in either direction. Instead there are really four moves: up, down, up then down. This tells us there is no overall trend in place.


A.) Prices broke through the downward sloping trend line and the 200 day EMA.

B.) Note the reversal in the EMAs -- all have turned upward. While the orientation of all three is still negative -- that is, the smaller is still below the longer etc... -- the movement is bullish. Also note that prices are above the EMAs which will contribute to this trend continuing.


A.) The MACD has given a buy signal.

B.) The accumulation/distribution line has been moving upward for the last 4 months. That tells us that despite the lack of overall direction, the overall tendency has been for people to accumulate Treasury's. That's especially interesting considering the stock market has rallied strongly over that period and the Treasury is issuing boatloads of debt. In other words, there is still a strong, fundamental long-term demand for Treasuries right now.

Monday, November 16, 2009

Today's Market


A.) Prices opened with a gap higher on good volume.

B.) Prices found support along various EMAs

C.) Prices broke through support and had increasing volume on the sell-off.

D.) Prices found support at the 200 day EMA.

Ideally, we'd like to see prices hold levels into the close as a sign of strength. When we see sell-off from gains on an intra-day basis it says traders are skittish about keeping positions overnight.

The Minimum Wage Canard (Revisited)

It's getting so tiresome to read about how the increases in minimum wage are the direct cause of skyrocketing teen unemployment. See here, here, and here for just three stories on the subject.

To support this argument, anti-minimum wage advocates trot out charts that generally look like this:


Now, what I see in this chart is that teen unemployment -- like most unemployment in general -- is much more highly correlated to recessionary periods in the economy than it is to the minimum wage. But that's just me. Honestly, I just can't look at that chart and seriously argue that there's a cause/effect relationship between minimum wage and teen unemployment. But we live in an age where arguments gain traction on the skimpiest of evidence (sometimes even none whatsoever -- see: the 1977 CRA caused the near economic collapse of 2008 -- a time bomb with a 30 year fuse!!!).

Allow me to make another argument, one that I think makes much more sense. I first made this argument over at Blah3, and I'll make it again here with some updated charts.

What I suspect is fairly simple: That simple demographics coupled with the damage wrought by this recession on the Baby Boom generation -- in terms of both real estate and investment portfolios (particularly retirement portfolios) -- is so great that many Boomers have realized they're going to have to postpone retirement (see one story on that here, there are thousands on "postponing retirement" out there on The Google).

Let's look at some charts and see if they might make more sense than the minimum wage argument. First up, let's look at the ratio of 55+ Employed persons/Teen Employed and see what that looks like:


Source: BLS.gov

Gee, what do you know -- this ratio has been on the increase since about the turn of the century, the exact time the first of the Boomers were turning...55. Whaddya know, they're staying in the workforce and, arguably, crowding their own kids out of it. There are now over 6 55+ employees in the workforce for every teen -- a record that shows little sign of letting up.

Second, let's look at the 55+ and Teen cohorts as a percent of the Employed Workforce. Again, what we see is that the older generation is crowding out the younger generation in a trend that well predates the recent set of minimum wage hikes we've seen.


Source: BLS.gov

Look at the two charts I've presented versus the absurdity at the top and ask yourself, which argument makes more sense? Which argument does the data seem to support?

In short, the minimum wage canard is yet another feeble political attempt to lay the economy's woes at the feet of Democrats. It's shameful, really, but not at all out of character. I expect I'll be revisiting this issue with each passing NFP print. Waste of time, but somebody's got to do it.

And, so I can preempt this ridiculous argument seven years hence (assuming the minimum wage rises again), here's a chart showing the BLS' forecast of exactly how lopsided these two cohorts are going to look in 2016:

What I suspect will happen in 2016, sadly, is that those with a political agenda will look at the numbers and claim the disparity is being caused by -- you guessed it -- minimum wage hikes that ocurred eight years prior.

'Nuf said.

Large vs. Small Business Decoupling Story Gaining Traction?

As Bonddad readers surely know, I've recently become fascinated by the hypothesis that small businesses are being left behind by whatever recovery is in store for the United States. Large businesses generally have three things that small businesses may lack: Strong(er) balance sheets, easier access to credit, and international revenues. Several of my posts have touched on this topic, and I recently cited a MarketWatch story by Rex Nutting, the NFIB's monthly SBET report [.pdf], and some mentions by economist David Rosenberg. It is, in fact, Rosie's work on Friday that has me revisiting this topic yet again. Wrote Mr. Rosenberg:

We noticed an interesting piece of research on U.S. GDP from Goldman Sachs’ Economics team that’s worth highlighting. The team questions whether the official government GDP statistics capture how poorly small businesses (ie, sole proprietorships) are doing. The weakness in small business sentiment is seemingly at odds with the recent 3.5% Q3 GDP reading but may explain why the unemployment rate has continued to steadily increase. Part of the reason for small business weakness is that most don’t have the same access to credit as larger firms and larger firms’ output tends to be better captured in the GDP data. While sole proprietorships tend to be small they collectively account for a nontrivial 17% of the U.S. economy.

The Goldman team uses a couple of different statistical approaches to test their thesis. They use timely data from the National Federation of Independent Business (NFIB) confidence survey, which shows that despite a recent improvement, confidence remains exceptionally weak (in fact two standard deviations below long-run trends). The first model suggests that the NFIB survey is consistent with overall GDP growth of 2.5% to 3.0% — not the 3.5% reported. As well, they find that current NFIB readings are more in line with below-50 readings on the ISM manufacturing index versus the actual reading of 55.7.

The second approach has to do with revisions to the GDP data and their relationship to the NFIB. U.S. GDP goes through many revisions as more, and better, information becomes available with lags — historically preliminary numbers are revised down by almost 0.5 percentage point. This second model suggests that Q3 GDP could be revised down by as much a 1-2 percentage points.

I've been trying to get my hands on the Goldman piece to read it for myself, but as yet have been unable to source it. In any event, it would appear that the decoupling story of large vs. small business is, perhaps, beginning to gain some traction. As a new and semi-permanent era of frugality dawns and consumers increasingly gravitate toward low-cost providers, I maintain this story will continue to percolate.

On a related note, I picked up this tidbit via Alan Abelson's Barron's column on Saturday regarding Friday's release of consumer sentiment:

"Richard Curtin, director of the survey, somewhat ruefully noted that a mere one in 10 consumers polled reported an increase in income, the fewest recorded in data that stretch back to 1946."

Stay tuned.

A Tale of Two Markets

Let's look at the difference between the S&P 100 (big stocks) and the Russell microcap index.


The S&P 100 continues to move higher. We have a clear pattern of lower lows (A) and lower highs (B). Also note the price EMA picture which is bullish -- all the EMAs are moving higher, the shorter EMAs are above the longer EMAs and prices are above all the EMAs.

In contrast:


A.) Prices formed a double top with the first top at the end of September and the second top at the end of October

B.) Prices fell to the 200 day EMA

C.) Note the bearish orientation of the shorter EMAs -- the shorter EMAs are below the longer EMAs, prices are below all the EMAs and all the shorter EMAs are moving lower.

In other words, big stocks have a bid and small stocks don't.

Saturday, November 14, 2009

Some Saturday Market Trivia

Since first closing above 10,000 (March 29, 1999), how many times, on a closing basis, has the Dow Jones Industrial Average traversed that level?

Mouse over for answer: 29

Weekend Mini-Dog

Since Bonddad didn't put up his regular weekend doggie post, here's a shot of our new addition, small enough to fit in one of my baseball caps. And no, my allegiance to the Vikings is not Favre related -- it dates back to the Purple People Eaters. We'll see you all on Monday.


Friday, November 13, 2009

Weekly Indicators

It was a light week for data, but what data there was continued to show economic expansion.

The BLS reported initial jobless claims of 502,000, and the 4 week moving average declined to 519,750, the lowest in a year.

The ICSC reported that same store retail sales declined -0.1% WoW, the first decline in 7 weeks, but YoY sales improved to +2.9%. They also said that "same-store sales for November could be as strong as +5.0- +8.0 percent [YoY] for the month."

Shoppertrak finally also joined in reporting positive numbers. For the week ending 11/7/09, they reported a Year Over Year % Change of 0.1%, and a Week Over Week % Change of 4.8%.

Oil declined slightly under $80 to about $78, so there is still a little rationality in that market.

The Daily Treasury Statement through November 10, showed payment of $47.4 million in withheld state and local taxes for the month so far, compared with last year's $51.6 million on the same date, indicating state and local government's in severe distress even compared with last year (this is a lagging indicator which tends to bottom about one quarter after the end of a recession on an absolute basis).

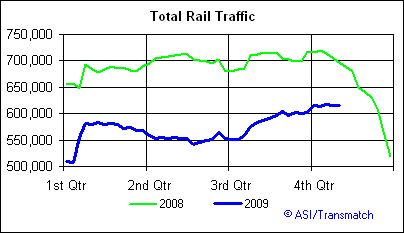
The most interesting weekly statistic, however, was rail traffic, which held steady. Why is that interesting? Because by now rail traffic should be well into its seasonal decline (last year the decline was a "cliff dive"), but traffic has generally held steady at September-early October's levels or even improved, as shown on this graph:


This is a very bullish sign for the economy.

Consumer Confidence Drops

From Reuters:

The Reuters/University of Michigan Surveys of Consumers said its preliminary index of sentiment for November fell to 66.0, the lowest level since August, from 70.6 in October. This was well below economists' median expectation of a reading of 71.0, according to a Reuters poll.

"Importantly, the decline in confidence was already in place before the announced increase in the unemployment rate to 10.2 percent on November 6," the Reuters/University of Michigan Surveys of Consumers said in a statement, adding "the likelihood that the sentiment index would drift even lower in the months ahead cannot be easily dismissed."

Within the survey, the 12-month economic outlook fell to its lowest since April.

Here is the chart:


We have two months of declines and a third is probably on the way. These are not good developments especially with the holiday shopping season already underway.


Why I'm Concerned About the Market

I'm a big fan of inter-market analysis -- that is, looking at a variety of markets rather than just one. On that front, I use the Russell 2000 as an index of risk capital. First, the Russell 2000 is

An index measuring the performance of the 2,000 smallest companies in the Russell 3000 Index, which is made up of 3,000 of the biggest U.S. stocks. The Russell 2000 serves as a benchmark for small cap stocks in the United States.


In other words, it's an index of companies that need a growing economy to increase profits. Unfortunately, the index is not sending us good signals.


A.) The IWMs (Russell 2000 ETF) printed a double top with the first top occurring in lagte Setember and the second top occurring in late October.

B.) Unlike the other markets, prices have not rallied to new highs, but instead have run into resistance at the 50% Fibonacci retracement level.

C.) Momentum is decreasing and has been for a few months. In addition, the MACD is now negative.

D.) The accumulation/distribution line is decreasing, indicating money is flowing out of the index.

But here's the kicker:


You could argue the Russell 2000 is forming a complex head and shoulders formation right now. That does not bode well for the future.

Forex Fridays


Notice that overall we are still in a very bearish pattern. The chart continues to print lower lows (A) and lower highs (A). All the EMAs are moving lower and the shorter EMAs are below the longer EMAs. However


Are prices printing a double bottom? Notice that the last two bottoms have been near the same level price wise. Also note the MACD printed a rising bottom (A) and the the RSI printed a higher number (B) on the second bottom.

Fundamentally it is difficult to see the dollar making big rise. US interest rates are very low and will be there for some time. Other countries (like Australia) are already raising their rates. While the US economy is growing, so are other regions. And there is little need for a safe haven play right now.

Yesterday's Market


A.) Prices moved higher through all the moving averages at the beginning of trading but could not hold the levels

B.) Prices move through all the EMAs printing strong bars and higher volume.

C.) Prices continue to run into resistance at various EMAs

D.) Prices again make a move lower as trading nears the end of the day.


A.) Notice how momentum has been decreasing for the last four months yet prices have been moving higher. Remember -- the MACD measures the difference between two EMAs. So long as that number is positive we're at worst moving sideways.

Thursday, November 12, 2009

Today's Market

I'll post this in the AM -- I'm swamped right now.

Read This Now

I commented on the volume ">situation yesterday. Cory over at Afraid to Trade takes the analysis a bit farther.

About the "Banks Not Lending" ....


Notice consumer credit loans typically flatline during a recession and a little bit after. The one exception was the 2001 recession. While we haven't had a contraction like the current contraction in consumer credit, the decline is consistent with recession experience.


C and I loans either flatline or decrease after a recession. Recent experience is 100% in line with historical patterns.

The point of these charts is simple: during and after a recession credit demand drops. The reason is really simple. People borrow less money when the future is uncertain.

As demonstrated in the latest senior loan survey lending terms are getting easier; banks are trying to make loans. My guess is the terms are still harder than they were at the height of the "if you have a pulse you can get a loan" phase of the last expansion. But the point is business and consumer borrowers are decreasing their loan appetite at the macro-level.

Initial Jobless Claims Continue To Move Lower

From the Department of Labor:

In the week ending Nov. 7, the advance figure for seasonally adjusted initial claims was 502,000, a decrease of 12,000 from the previous week's revised figure of 514,000. The 4-week moving average was 519,750, a decrease of 4,500 from the previous week's revised average of 524,250.


Here is the relevant chart:


Here is a chart from the St. Louis Federal Reserve that shows the long-term trend for the 4-week average. This chart has not been updated with the latest reading:


This was the first piece of data that clued me into the fact that the recession was ending. The first time I noticed the continued decline in the 4-week moving average was maybe June(?) (there was a Barron's article that highlighted the trend). Since then the 4-week moving average has continued to move lower. Notice that the 4-week moving average is a good indicator for the end of a recession as evidenced from the previous recessions.

From NDD:

The 4 week moving average, at 519,750, is the lowest reading in a year, since the equal number on November 19, 2008. It appears the weekly jobless claims data are getting reading to test my hypothesis that net new jobs will be added if the jobless claims simply stay at this level for a few more weeks. In that regard, at the time of the 501,250 new jobless claims reading in 1990, payrolls lost 160,000 that month and 211,000 the next. In 2001, the new jobless claims high of 489,250 coincided with payroll losses of 325,000 that month and 292,000 the next. This year, we have already seen in August new jobless claims in the 560,000-570,000 range coinciding with a payroll loss of 151,000.

I have also surmised that, while Calculated Risk is correct that there will be little seasonal hiring this year, there will also be little seasonal firing this year either (believe it or not, layoffs increase dramatically as you move from September through New Year’s Day). Here is how the UNadjusted jobless claims look from their September lows through the first full week of November in the last 4 years:

2006: +86,500 weekly new claims

2007: +80,300 weekly new claims

2008: +203,100 weekly new claims

2009: +118,300 weekly new claims

In other words, so far my hypothesis is largely correct.

Thursday Oil Market Round-Up


The oil market is forming a classic pennant formation. There may be some issue with which top line trend line to use. I have added A and B because both are technically correct. Trend lines connect important points on the chart. Trend line A connects the tops of the candle's shadows which are the highest points of the candles. Trend line B starts and ends at the top of a candles and moves through various shadows. Regardless of which trend line you like the point is the tops are pointing downward.

C.) Prices bounced off of the 200 day EMA. This indicates we're still in a bull market.

We're still in a bullish EMA situation -- shorter EMAs are above longer EMAs and all the EMAs are moving higher. But the fact that prices are in a consolidation pattern indicates oil is waiting for something.

Wednesday, November 11, 2009

Today's Market

I'm not sure what to make of the market right now. Consider these charts:


A.) Volume has been decidedly weak.

B.) The market has printed two spinning tops the last two days. In addition, prices have yet to breach the technical level established a few weeks ago. In fact, prices ran into resistance just below that level, crossed it sometime today and couldn't keep the momentum going.


A.) Volume on this rally in the transports has been better -- we have had some decent days. But overall it is still weak.

B.) Prices however have printed some strong bars.


A.) Volume has been weak.

B.) Prices have printed one spinning top and one doji -- both weak patterns. And prices crossed technically important levels but couldn't keep going higher. That's weak.