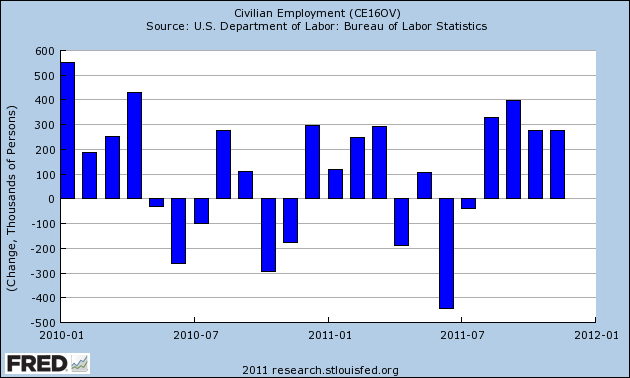
Wednesday, December 7, 2011

Morning Market


Over the last few days, I've expressed concern about the strength of the stock market's current rally.  Yesterday only added to my concern.  The top chart shows the daily chart, which is still moving sideways.  Yesterday's price action merely lowered the consolidation range to 125 from 125.5.


The TLTs are right at long-term support.  For a move lower to be significant, we'd need to see a move below at least 116. 


Looking at the technicals, we see a strong inflow in the form a a risking A/D and CMF.  But we also see declining momentum in the lower MACD.  Normally, I'd be more inclined to rely on the volume metrics.  But, remember that long-term prices are near historically high levels.

State Tax Revenue increased nominally, flat in real terms as of 3Q 2011

- by New Deal democrat

With the temporary lull in dramatic (US) economic direction, I have been updating a number of metrics I haven't looked at in awhile. Two weeks ago, I looked at leading indicators for jobs. Last week I examined real wages and the savings rate.

This week I'm revisiting state tax receipts. These lag the economy, and reports on state tax receipts badly lag even that. Because I knew they would turn up after the other data already had, I used to pillory Mish about sales tax receipts in particular. Needless to say, Mish, who used to religiously report these, stopped after they unequivocally turned against him. With last summer's near stall, however, in real terms these seem to have stalled as well as of the most recent (summer) reported data.

The Census Bureau has reported on state and local tax revenue collected in the second calendar quarter of 2011, and the Rockefeller Institute has also reported on preliminary collections from the third quarter.

According to the Rockefeller Institute report:
State tax revenues grew by 10.8 percent in the second quarter of 2011, and by 8.4 percent annually for the period that ended the fiscal year for 46 states -- marking six straight quarters of growth and the strongest annual gains since 2005, ....

[E]very state but one (New Hampshire) reported an increase in overall tax collections compared to the year-ago period ....

[Further, p]reliminary figures for July and August 2011 suggest continued, though less robust, growth in revenues. Overall collections in 41 early-reporting states showed average gains of 6.8 percent compared to the same months of 2010.

....
Even for states, the longer term revenue picture remains mixed. Despite the recent gains, states' tax revenues remained lower in the second quarter than they were four years earlier.
Local governments, which rely heavily on property tax payments, are in worsening shape:
Tax collections for local governments, meanwhile, have headed in the opposite direction. The second quarter of 2011 marked the third consecutive quarter of declines in local property tax revenues. In total, local property taxes declined by 1 percent in the second quarter of 2011 compared to the same quarter of 2010.
Here is an updated graph of state tax revenues, seasonally adjusting by .775 for the second quarter (which includes April 15), beginning with the first fiscal quarter of 2008 (or the third calendar quarter of 2007) :

Fiscal QuarterRevenues* ($ billions)Inflation- adjusted Revenues% off of peak
1Q 2008176.4183.8-1.5%
2Q 2008178.7183.6-1.6%
3Q 2008181.4184.6-1.1%
4Q 2008240.8 (186.6)186.60
1Q 2009181.2179.9-3.6%
2Q 2009171.4176.2-5.6%
3Q 2009159.2162.7-12.8%
4Q 2009201.4 (156.1)158.1 - 15.3%
1Q 2010161.4162.4- 13.0%
2Q 2010166.1166.2- 10.9%
3Q 2010164.5 164.2- 12.0%
4Q 2010205.3 (159.1)159.4- 14.6%
1Q 2011168.7167.8- 10.1%
2Q 2011178.8175.6- 5.9%
3Q 2011180.2174.6- 6.4%
4Q 2011226.0(175.2)167.8-10.1%
1Q 2012180.2 (p*)171.6 (p*)-8.1%(p)*

(p*=preliminary)

In summary, while in nominal terms state tax revenues have made back all but less than 4% of their entire shortfall off peak pre-recession revenues, measured in real terms they have stalled in the last several quarters. Meanwhile population has increased, and states have been facing record unemployment payouts. As I've said before, while there has been strong improvement, it still hasn't been enough.

Even worse, local governments, which rely on property taxes, are suffering from decreased revenues as well as decreased aid from the states.

If ECRI's prediction of another recession in the immediate future does turn out to be true, it is going to be brutal for state and local governments.

ISM Manufacturing and GDP


Yesterday, I wrote about the latest ISM manufacturing report.  The above chart shows why I think this is an important data series.  I've compared the ISM monthly index to the year over year percentage change in GDP.  Notice that the data series follow each other pretty closely.  It's not an exact match, but there is some similarity.


The above chart is the ISMs new orders index and the YOY percentage change in GDP.  The relationship here is a bit weaker, although it still exists.  For example, notice the big jump in new orders coming out of the 2000 recession that wasn't followed by a bug jump in GDP.  However, the relationship did exist coming out of the early 1980s and 1990s recession.


The above chart is the ISM's production index relative to YOY GDP.  Again, we see a general correlation.

The above charts indicate that the ISM is a decent, coincident indicator of GDP. 

Morning Market


The SPYs price action over the last five days explains my concern about its supposed "break-out" from a consolidation pattern.  Prices gapped higher and then moved higher for 2 and a half days.  Prices broke trend on the third day of the rally and have been consolidating for the last two days between 125.5 and 127.  While prices are still above the 200 minute EMA, this is a rally whose steam is running out.


Ideally, when prices break out from a consolidation pattern, we'd like to see long bars on high volume.  Here we have the exact opposite -- weak bars on low volume.  In addition,


We see the same pattern play out in the other averages -- prices broke out but did so on low volume.  In addition, none of the bars are green, indicating prices closed higher at the close.  As break-outs go, these are really terrible.

 Oil prices continue to consolidate.  Key prices levels to watch for are 102.75/103 and 96.

Tuesday, December 6, 2011

November housing roundup

; - by New Deal democrat

Two months ago I wrote that It's time to admit that house prices have stopped falling. November's housing price data rendered a split decision on that forecast, as asking prices from Housing Tracker confirmed a bottom, while data of repeat house sales in Case-Shiller contrarily did - finally - make a new low under their March 2011 level.

First, here is the 20 city Case Shiller index (from October 2008 to emphasize the post-crash reports, including the effects of the $8000 housing credit):


While the Case Shiller indexes report comparable sales prices, Housing Tracker reports asking prices in 54 metropolitan areas. I follow these because they showed the peak in the housing market at the beginning of 2006 before the Case Shiller sales prices did, and because since then they have led trend changes in the Case Shiller reports by about 4 to 6 months -- which makes sense, since houses are put on the market with asking prices months before they go under contract.

Comparing the Case Shiller graph above with this graph of asking prices for the 75th (yellow), 50th (green), and 25th (blue) percentiles for the last 5+ years at Housing Tracker shows that asking prices have been bottoming out for a year:


Indeed, Housing Tracker's data for all of November showed the YoY rate of declines on a monthly basis is now only -0.7% YoY. Here's the updated chart:

Month2007 2008 2009 2010 2011
January ----7.5%-11.5%-5.8%-8.7%
February ----7.8%-12.0% -5.2%-8.4%
March ----8.3% -10.9%-5.0%-7.3%
April -2.7% -8.6%-9.6%-5.0%-6.8%
May -3.5% -9.1% -8.1%-5.0%-5.6%
June -5.0%-9.8%-7.0%-5.0%-4.4%
July -5.4% -10.4%-6.1% -5.1%-4.2%
August -6.0% -10.6%-5.5%-6.1%-2.8%
September -6.2% -11.1%-5.1%-6.6%-1.7%
October -6.7% -11.4% -4.5%-7.0%-0.9%
November -6.6%-11.7%-4.5%-6.7%-0.7%
December -7.2% -11.4%-5.6% -7.8%---


Housing Tracker's weekly YoY comparisons for November are instructive: in order, they were -0.9%, -0.5%, -0.3%, and +0.1%. December will tell, but it appears that the turning point has been reached.

Note that the YoY% decline in asking prices bottomed in January of this year. Case Shiller data shows that the change in YoY% decline in sales prices bottomed in May and June, and has been receding since, as shown in this graph:


Keep in mind that even after a nominal bottom in housing prices, there is likely to be an extended period where they are still declining in real, inflation-adjusted terms. Prof. Shiller himself believes another 15% or more decline in real terms is likely, and I do not have any reason to disagree with that.

Indeed, adjusting the 10 and 20 city Case Shiller reports for average wages paid (where the beginning of the 20 city index in January 2000 = 100%), shows that in real terms, the average wage buys more house than at any point since that series began, and is only about 10% above the 10 city's average in the late 1980s and 1990s:


The discrepancy between the Case Shiller and Housing Tracker reports will get resolved one way or the other. I continue to expect Housing Tracker to be the leading series. In that regard, Bill McBride a/k/a Calculated Risk has noted that typically price inflection points are reached at about 6 months' housing supply -- more than that means declining prices ahead, less than that means rising prices ahead. As of the October housing sales reports, new home supply is at 6.3 months and has been declining at a rate of 2 months per year for the last several years. Existing home supply is at 8.0 months, and while the trend was distorted much more by the housing credit, recently inventory has been declining at a -10% YoY rate, which has also coincided with a rate of decline of 2 months' inventory per year. If those trends continue, then within a year both will be under 6.0 months and under CR's metric, we should expect housing prices to be increasing.

ISM Manufacturing Show Continued Expansion

From the ISM Manufacturing Report:


"The PMI registered 52.7 percent, an increase of 1.9 percentage points from October's reading of 50.8 percent, indicating expansion in the manufacturing sector for the 28th consecutive month. The New Orders Index increased 4.3 percentage points from October to 56.7 percent, reflecting the second month of growth after three months of contraction. While the Prices Index, at 45 percent, increased 4 percentage points from the October reading of 41 percent, prices of raw materials continued to decrease (registering below 50 percent) for the second consecutive month. Respondents cite continuing concerns about the general economic environment, government regulations and European financial conditions, but are cautiously more optimistic about the next few months based on lower raw materials pricing and favorable levels of new orders."


There are a few odd points to mention.  First, of 18 industries that are reporting growth, 9 are reporting a slowdown while 8 are reporting growth.  In addition, five industries are reporting new orders growth while 6 are reporting slowing growth.  This means that pace of growth in the expanding industries is higher than the pace of decline in the slowing industries.

Let's look at the anecdotal information:


"Business still holding its own. Some growth in margin now that some of the raw materials prices have abated. Oil is pushing $100 so that has not been favorable." (Chemical Products)

"Orders for the remaining two months have increased after an extended 'summer dip' in sales overall. We expect to finish the year approximately 10 percent above 2010." (Electrical Equipment, Appliances & Components)

"Seeing a slight slowdown in orders; could be related to the holidays." (Primary Metals)

"Material lead times are getting longer. Seems like no one is hiring. Trying to do twice the output with the same amount of people." (Food, Beverage & Tobacco Products)"Japanese auto production has returned to 100 percent, and domestic manufacturing continues to increase." (Fabricated Metal Products)

"Oil exploration seems to be really picking up. Government is permitting again, so business is the busiest we've ever seen." (Computer & Electronic Products)

"The EPS ruling about higher fees for coal-generated electricity can have a huge, negative impact on our business if implemented in January 2012. We are at the peak of our seasonal demand push." (Plastics & Rubber Products)

"Thailand flood impacting our business. Honda and Toyota cut production forecasts, and we are chasing some components made in Thailand." (Transportation Equipment)


Note that most of the information above is positive.

Let's coordinate the above data with the recently released Beige Book:


Manufacturing activity grew at a steady pace across most of the country, with all Districts other than St. Louis reporting increases in orders, shipments, or production. Chicago, St. Louis, and San Francisco reported positive results in metals and fabrication, while Cleveland saw flat steel production and Philadelphia noted decreased demand for primary metals. Cleveland and Chicago reported increased auto production year over year, but Boston noted signs of slower auto component production. Dallas saw steady demand for electronics, computers, and high-technology goods, but San Francisco reported that demand for consumer electronics continued to decrease. Philadelphia, Cleveland, and Chicago saw increased production of energy-related products. For construction-related goods, Chicago and Minneapolis reported declining demand, while Dallas said demand was stable. Overall, St. Louis saw more plant closures than plant openings or expansions. Freight transportation volumes increased in Cleveland, held steady in Atlanta and Kansas City, and were mixed in Dallas.


In short, manufacturing is holding its own.  Let's take a look at the data in graph form:


Although the composite number dropped to just above 50, the latest reading gives us some "breathing room."


Although new orders are skewed (see above) the overall print is strong.


The overall production index is also shows a good print.


However, the employment number is still weak, although it does show slight expansion in this area as well.

No, Barry, Ratings Agencies Don't Matter

Over at the Big Picture, Barry asks a good question: do ratings agencies still matter?  

No. Watch the bond and currency markets to see what the market really thinks.


Monday, December 5, 2011

Morning Market -- Consolidation Mania


The above charts are all the major indexes I track with the exception of oil.  The treasury market, gold and the dollar are all clearly in a consolidation area and while the equity markets have technically "broken out," their respective break-outs are extremely weak, indicating they are probably false break-outs.

Remember, markets can move either vertically or horizontally.  Ideally, we want them to move vertically because then we can make bets on the length and strength of the move.  While we can still place bets (make trades) when prices move horizontally, it's a much harder game to plan. 

So, what does all this mean?  There are a few points:

1.) The fundamental news hasn't changed in a meaningful way over the last 6 months.  The US economy is growing, bit slowly.  Europe is just this side of a meltdown; Asia is still growing, but they are growing more and more cautious given the macro situation.  In short, it's the same old song and dance.  In short, the markets tell us we're in the middle of economic stasis, which we more or less are.

2.) At the same time, the markets currently tell us that safety is very important (the high price of treasuries), there is still inflationary concern (the high price of gold), the US is still weak (the low position of the dollar) and the US economic rebound is in question (US equities).

3.) There is also some end of the year portfolio management going on.  Managers who had big gains are holding on to the last possible minute to sell to make sure they've locked in their gains for year.  

Bonddad Linkfest

  1. Government data on corn crop increasingly unreliable
  2. Corn futures liquidation to continue
  3. US farm exports hit by competition
  4. German activity falls into contraction territory
  5. UK service sector employment falls
  6. EU economy shrinks
  7. Spanish industrial output drops

Auto Sales Have Rebounded


After cratering earlier this year, auto sales have rebounded strongly. 

The Going Nowhere Economy, Redux

From the latest Beige Book:


Overall economic activity increased at a slow to moderate pace since the previous report across all Federal Reserve Districts except St. Louis, which reported a decline in economic activity. District reports indicated that consumer spending rose modestly during the reporting period. Motor vehicle sales increased in a number of Districts, and tourism showed signs of strength. Business service activity was flat to higher since the previous report. Manufacturing activity expanded at a steady pace across most of the country. Overall bank lending increased slightly since the previous report, and home refinancing grew at a more rapid pace. Changes in credit standards and credit quality varied across Districts. Residential real estate activity generally remained sluggish, and commercial real estate activity remained lackluster across most of the nation. Single family home construction was weak and commercial construction was slow. Districts mostly reported favorable agricultural conditions. Activity in the energy and mining sectors increased since the previous report.

Hiring was generally subdued, although some firms with open positions reported difficulty finding qualified applicants. Wages and salaries remained stable across Districts. Overall price increases remained subdued, and some cost pressures were reported to have eased.


Overall growth was "slow to moderate."  These are not the types of words you want to hear when describing your economy.  Yet that's exactly where we've been for the last year -- stuck in slow growth.

Note the one thing that is missing from this report: real estate growth.   

Notes on Friday's employment report: positive trends intact, actual good news in household survey

- by New Deal democrat

Friday's employment report continued the trends of employment as continued to initial jobless claims that were established in March 2009.

First of all, here is the updated graph comparing population-adjusted initial jobless claims with payrolls:


This relationship was historically very close beginning in 1967 but broke down in 2009. For the last two years, however, the new relationship established then has continued. A change in the population adjusted initial jobless claims rate is mirrored in the unemployment rate, frequently with a 1 or 2 month delay:


I've also noted that if we were to be heading towards a "double-dip," we should expect the relationship between the number of initial jobless claims and employment growth to change, whereby in the net many more jobs are lost per any given rate of initial claims. Although there may be some very slight drift in that direction since April (brown points), it hasn't happened in any meaningful way:


The longer term leading relationship of initial jobless claims to the unemployment rate (comparing the last 6 months' average with the average over the same six month period one year prior) as measured by Thumbcharts is also intact:


Finally, back in December 2009, Prof. Paul Krugman said:
I thought it might be useful to create a sort of benchmark for the level of job growth that would really count as good news.
[L]et’s set a … modest goal: return to more or less full employment in 5 years –which means seven lean years of depressed employment. To keep up with population growth over those 7 years, the United States would have had to add 84 times 127,000 or 10.668 million jobs. (If that sounds high, bear in mind that we added more than 20 million jobs over the 8 Clinton years). Add in the need to make up lost ground, and we’re at around 18 million jobs over the next five years — or 300,000 a month.

So that’s a useful benchmark.
(emphasis mine)

With that in mind, here's a graph of monthly gains in civilian employment from the Household Survey since its bottom:


No, it isn't the more generally reported Establishment Survey data, but the Household Survey does tend to lead at inflection points, and for the last 4 months, the average employment gain in the Household Survey has been 321,000/month, with the lowest being 277,000. I'm not nitpicking the Professor, but it's worth noting that this does meet Prof. Krugman's threshold criteria for actual good employment news.

Sunday, December 4, 2011

Morning Market


Last week, oil's primary price movement occurred on Tuesday and Wednesday, when prices made an equal move higher -- they advanced on Tuesday morning, consolidated Tuesday afternoon and Wednesday morning, and then advanced an equal distance on Wednesday.  Interestingly, prices did not advance strongly on Friday when the unemployment report was printed, instead staying below the 101/101.5 level.

On the daily chart, we see the EMAs printing a very bullish outlook, but prices are still between two important levels, indicating we'll probably see consolidation for the next few weeks as traders get a better idea for the overall macro-level economic direction.


Pulling the lens back, we see the dollar was clearly in a downtrend and head and shoulders formation for 2010.  The downtrend was caused by the Fed's 0% interest rate policy and massive fiscal stimulus.  However, for the last few months, the dollar has benefited from being the "least dirty shirt in the hamper" -- especially in relation to the euro.  As such, we're seeing prices consolidate at the bottom of the downward trend.  There are two important lower levels to keep in mind -- 21 (which is right below the current lower trend line) and the lower trend line itself.


The above chart is a six day chart of the SPYs.  Prices gapped higher on Monday, consolidated for two days, then gapped higher on Wednesday due to the coordinated central bank move.  However, Prices did not move higher on Friday in response to the employment report.  Some of that may be due to the strong rally prices saw all week.   But, there were some very good points to the employment report which were economic positives.


The daily chart shows that prices are still in a consolidation trend.  And even though we had a good jobs print on Friday, prices did not follow through on the rally to break out of the consolidation trend.  Instead, prices fell back within the symmetrical triangle.

Saturday, December 3, 2011

Weekly Indicators: Asking prices for houses turn positive YoY edition

- by New Deal democrat

The big monthly number was yesterday's employment report, showing 120,000 jobs added to the economy in November. September and October were also revised up by a total of 72,000, conintuing the string of upward revisions. The household survey was even more impressive, up 278,000 jobs. The last 4 months in this survey have shown gains averaging 321,000 a month. Unemployment declined to 8.6%, the lowest since March 2009. Only half of the 0.4 decline was due to participants leaving the workforce, as to which the phrase "retiring baby boomers" assumes ever-increasing importance. Two important internals were weak: manufacturing hours, one of the 10 LEI, declined by .2. Wages actually decreased by $.02 continuing the ominous real wage deflation of this year.

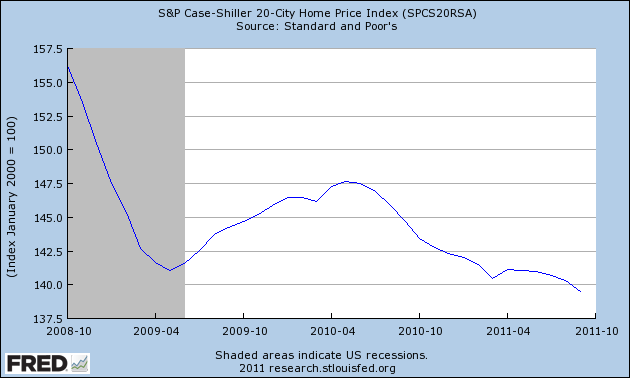
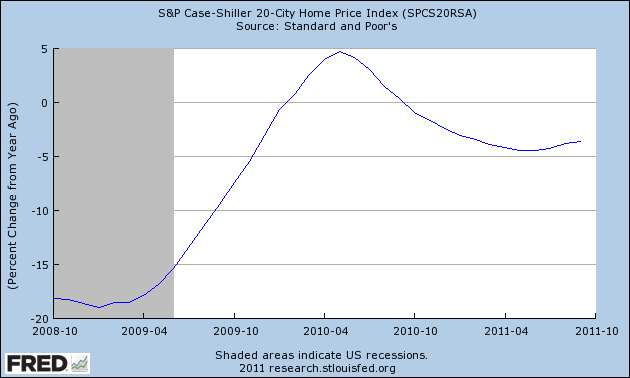
In other monthly news, manufacturing improved (although vendor deliveries, another of the LEI, decreased). Auto sales were up, and at their strongest level ex cash for clunkers since August 2008. Consumer confidence rebounded strongly, taking back over half of its decline since the end of June. New home sales were flat, and the Case-Shiller index of home prices declined more than expected, althought its YoY% decline continues to lessen.

Before turning to the high frequency weakly data, let me remind new readers that this post is not designed to be a "big picture" look at the economy. Quite the reverse: if we think of the economy like a motion picture with 24 frames per second, this post compares the most recent frame with the frame just preceding. In other words, it is a snapshot of as close as we can get to the present moment. Before any change in direction in monthly data is confirmed by two successive reports, there will be at least 8 weekly datapoints, which will show the change first.

Let's start with the small sea-change in housing. For the first time since the inception of the series over 4 1/2 years ago, YoY weekly median asking house prices from 54 metropolitan areas at Housing Tracker were positive, up +0.1% YoY for the last full week of November. The areas with YoY% increases in price decreased by 1 to 20. Only Chicago continued to have a double-digit YoY% decline. The monthly number for all of November was still down -0.7% YoY, which is still the smallest monthly YoY decline since the series began. Housing Tracker's asking prices have generally led sales prices at turning points and in the second derivative by 4 to 6 months over the history of the series, so this suggests that the Case-Shiller index YoY decrease will continue to lessen in coming months, and may turn positive nominally by next summer.

Meanwhile, the Mortgage Bankers' Association reported that seasonally adjusted purchase mortgage applications decreased -0.5% last week. On a YoY basis, purchase applications were down -8.2%. This primarily reflects a multi-week spike last year vs. flatness this year. The actual reading remains firmly within the range that purchase mortgage applications have been in since May 2010. Refinancing fell -15.3% w/w. Refinancing continues to be extremely volatile.

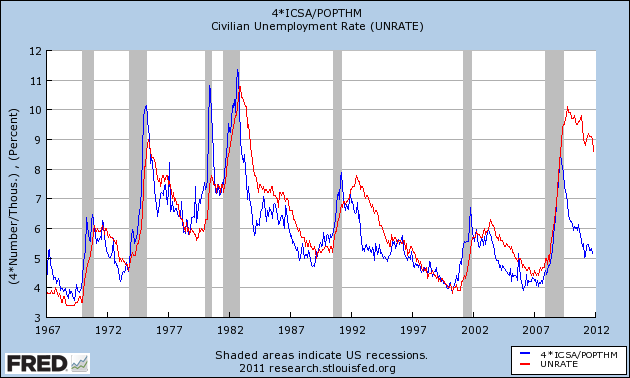
Turning to jobs, the BLS reported that Initial jobless claims rose 9000 to 402,000. This is 14,000 above the 388,000 low of 2 weeks ago. The four week average rose 1500 to 395,750.

The American Staffing Association Index remained at 92 last week. This series continues its slight upward trajectory, but remains slightly below last year's levels.

Tax withholding for the 20 reporting days of November was significantly down from last year's levels. Adjusting +1.07% due to the 2011 tax compromise, the Daily Treasury Statement showed that for this November, $135.5 B was collected vs. $138.9 B a year ago, a decline of -2.4 B. Before concluding that the economy has suddenly weakened, however, note that this November began on a Tuesday whereas November 2010 began on a Monday. That means that this November only had 4 Mondays vs. last November's 5. Tax collections are typically stronger on Mondays and much stronger on the first of the month. Usually the 20 day moving average takes care of that issue (4 x each weekday), but because of holidays in November, that didn't apply. When I correct for this by measuring 20 days beginning Monday October 31, 2011 or Tuesday November 2, 2010, the anomaly disappears, and tax collections for the 20 day period are up $1.8 B or $1.7 B respectively, or about +1.3% YoY.

Retail same store sales remained positive as they have been all year. The ICSC reported that same store sales for the week of November 26 increased 4.0% YoY, and 1.7% week over week. Shoppertrak reported that YoY sales rose 4.4% YoY.

The American Association of Railroads reported that total carloads increased 3.9% YoY, up about 17,000 carloads YoY to 456,200. Intermodal traffic (a proxy for imports and exports) was up 6700 carloads, or 3.7% YoY. The remaining baseline plus cyclical traffic increased 10,200 carloads or 4.0% YoY. Total rail traffic has staged an impressive rebound in the last couple of months.

Money supply continues to stabilize after its Euro crisis induced tsunami. M1 decreased -0.5% last week, and is up a slight 0.2% month over month. It remains up 18.7% YoY, so Real M1 remains up 15.1%. This is about 5% under its peak YoY gain several months ago. M2 also decreased -0.4% w/w. It remained up 0.3% m/m, and 9.4% YoY, so Real M2 was up 5.8%.

Weekly BAA commercial bond rates declined .05% to 5.11%. Yields on 10 year treasury bonds fell even more, down .08% to 1.94%. In the last couple of weeks, spreads have started to widen again, representing increasing weakness.

Finally, the Oil choke collar is tightening, as Oil closed just below $101 a barrel on Friday. This about $6 above the recession-trigger level calculated by analyst Steve Kopits. Gas at the pump, however, decreased $.06 to $3.31 a gallon. Measured this way, we probably are only about $.05 to $.10 above the 2008 recession trigger level. Gasoline usage was off YoY, but by considerably less, at 8769 M gallons vs. 8867 M a year ago, or -1.1%. The 4 week moving average is off -2.9%, which is also less of a decline compared with recent weeks.

With the vital exception of real wage deflation, the picture now is very similar to that of a year ago. Having dodged a double-dip recession, the economy then showed signs of becoming a self-sustaining recovery, only to be strangled by the Oil choke collar (with an assist by the tsunami in Japan) in March. It looks like we've dodged another bullet, but the Oil choke collar is tightening again.

Have a nice weekend.

Friday, December 2, 2011

Unemployment at 8.6%; Jobs Up 120,000

From the BLS:


The unemployment rate fell by 0.4 percentage point to 8.6 percent in November, andnonfarm payroll employment rose by 120,000, the U.S. Bureau of Labor Statisticsreported today. Employment continued to trend up in retail trade, leisure andhospitality, professional and business services, and health care. Governmentemployment continued to trend down.
So far, so good. Now let's look at the details:


In November, the unemployment rate declined by 0.4 percentage point to 8.6 percent.From April through October, the rate held in a narrow range from 9.0 to 9.2 percent.The number of unemployed persons, at 13.3 million, was down by 594,000 in November.The labor force, which is the sum of the unemployed and employed, was down by alittle more than half that amount.
This takes a bit of an explanation. The unemployment rate is derived from the household survey, which gives us several important employment numbers. First, we get the civilian labor force, which comprises the denominator of the unemployment fraction (The civilian labor force is the total number of employed and unemployed people in the country). This amount decreased by 315,000. In addition, the number of employed in the household survey increased by 278,000 while the number of unemployed decreased by 594,000. Finally, the "not in the labor force" number increased by 487,000 (also remember that this number is horribly misunderstood and misrepresented. The increase could have just as easily been caused by an increase in the number of people retiring as from people giving up looking).

So putting this all together, we get the following:

More people are working (+278,000)
Fewer people are unemployed (-594,000) -- this number was a little more than twice the number of people employed.
The denominator of the equation decreased.

Overall, not bad. Some of the decrease was actually do to people not being unemployed.

Expect more discussion about the labor force participation rate from this report -- which decreased to 64%. I've discussed this before, but it bears repeating; we're now in an age when baby boomers are retiring -- meaning this number will probably be lower for the foreseeable future (in fact, I would argue the shape of the labor force has fundamentally changed because of this).

Let's move onto the establishment data:


Employment in retail trade rose by 50,000 in November, with much of the increaseoccurring in clothing and clothing accessories stores (+27,000) and in electronicsand appliance stores (+5,000). Since reaching an employment trough in December 2009,retailers have added an average of 14,000 jobs per month.

Employment in leisure and hospitality continued to trend up in November (+22,000).Within the industry, food services and drinking places added 33,000 jobs. This gainmore than offset a loss of 12,000 jobs in the accommodation industry. In the last12 months, leisure and hospitality added 253,000 jobs, largely driven by employmentincreases in food services and drinking places.

Employment in professional and business services continued to trend up in November(+33,000). Modest job gains continued in temporary help services.Health care employment continued to rise in November (+17,000). Within the industry,hospitals added 9,000 jobs. Over the past 12 months, health care has added an averageof 27,000 jobs per month.

Manufacturing employment changed little over the month and has remained essentiallyunchanged since July. In November, fabricated metal products added 8,000 jobs, whileelectronic instruments lost 2,000 jobs.

Construction employment showed little movement in November. Employment in theindustry has shown little change, on net, since early 2010.

Government employment continued to trend down in November, with a decline in the U.S.Postal Service (-5,000). Employment in both state government and local government hasbeen trending down since the second half of 2008.
We see an overall improvement across the board in the establishment survey, with the exception of government employment.

On a scale of 1-10, I'd give this a 5.5.

-------------

NDD here with a few additional comments:

The best news is the continuing upward revisions of past reports. September and October were revised up a total of 72,000. For the last three months, the average gain was 143,000.

The more volatile household survey employment measure showed a gain of 278,000 in November on top of a gain of 277,000 in October. Since the household survey tends to lead at inflection points, these are very good numbers.

While the decline in the labor force will be trumpeted by bearish sites, this is responsible for only half of the .4 decline in the unemployment rate.

There were negatives, though. (1) Average hourly earnings actually decreased $.02. This is another reinforcing shot of real wage deflation. (2) The manufacturing workweek declined 2/10's of an hour. This is one of the 10 LEI, and is a significant negative although it just took back last month's gain. Over a longer period, this series is now trending sideways. (3) Only 2000 manufacturing jobs were added. This leading series is also trending sideways. (4) There was a slight decline in aggregate hours worked, although the longer trend remains strongly higher.

My bottom line is that the economy is once again showing strength - but this will once again trigger the Oil choke collar.

Morning Market


Looking at a chart of the SPYs, we see that prices have formed a symmetrical triangle.  However, while we see a technical compliance with this pattern, it's a moderately weak formation.  Notice that for a period of about two weeks, prices clung to the upper trend line.  Ideally, in a triangle formation, we'd like to see clean hits followed by a more away from the trend line.  And while we do see strong volume on the break-out move, the fundamental back-drop is less than encouraging.  I personally don't think there is any positive reason for the recent coordinated bank liquidity move.  In addition, the EU situation continues to hang on the precipice.  In short, I wouldn't be trading this as an upside break out just yet.  Prices would need to move through the 129 price level before I'd commit to the rally.

After breaking a strong upward trend, oil prices are now consolidating between the 96 and roughly 102.5 price level.  However, the overall trend is still strong -- all the EMAs are moving higher, prices are above the EMAs and the MACD is about to give a buy signal.  Fundamentally, we're not in the summer driving season and there is continued talk of an economic slowdown (some economists are now stating Europe is already in a recession).  That being the case, it's hard to see a strong rally emerging should prices move through the 102 area.


The longer (IEF) and long (TLT) end of the Treasury curve also appear to be consolidating. 

Thursday, December 1, 2011

Eurodoom

Yesterday, Matt Yglesias wrote a great column, that I believe explains part of the reason for the coordinated central bank action.  Read the whole thing, but here is the meat of his argument:


But a different kind of analysis suggests that the United States could face catastrophe if the Eurozone tanks.

This terrifying possibility is suggested in a Nov. 7 lecture by Princeton professor Hyun Song Shi, “Global Banking Glut and Loan Risk Premium” (PDF). The starting point for his analysis is the fact—well-known to financial practitioners, unknown to the public, and perennially rediscovered by the economics profession—that a very large share of the world’s dollars are held in non-American accounts. Indeed, for several years in the late aughts the total dollar assets of non-American banks actually exceeded the total assets of the U.S. commercial banking system and even today the ratio is close to 1:1.

These foreign dollars—mostly held by European-headquartered global conglomerates—are not isolated from the American economy. Just as U.S. firms and households deposit money in American banks and take loans from the banks, European global banks intermediate between savers and spenders of dollars. A 2010 Bank of International Settlements survey (PDF) revealed that as of 2009, 161 foreign banks were operating 226 branches in the United States that raised more than $1 trillion in wholesale funding, largely through money markets. Dollars raised in the United States tend to ultimately work their way back to the United States (which, after all, is where you can use dollars to buy things) through the shadow banking system. European banks aren’t the only ones in this game, but they are the largest player. The upshot is that decisions made in Europe about how much leverage to take on play almost as big a role in determining American credit conditions as do decisions made in the United States.

The lecture goes on to argue that European decision-making played a large role in inflating the now departed credit bubble of the mid-aughts, an interesting technical issue that needn’t keep you up late at night. The implication, however, is that a massive and sudden contraction of the European banking system would have the effect of automatically contracting credit conditions in the United States. If European credit markets tightened, the dollars held by European banks would suddenly become much less available as the basis for lending to American financial intermediaries and, ultimately, firms and households.

As George Mason University economist Tyler Cowen put it "if true, we are doomed."

It sounds counterintuitive to believe that less lending and less debt could be a problem when we’re currently suffering from the excessive borrowing of the past. But this hangover theory is mistaken. Less credit and less borrowing now will only make our problems worse. Some currently solvent enterprises and households will be pushed into bankruptcy by difficultly rolling over their current debt. Others will curtail purchases and investments. Both factors will reduce incomes and drive overall spending down, further adding to America’s already large stock of idle facilities and unemployed workers. The punch will come, in other words, not because the collapse of the European banking system will cripple the European economy and thus indirectly hurt our ability to sell things to Europeans. Instead the collapse of the European banking system will directly cripple an American economy that depends on European banks to provide a fair share of our credit. The middling growth of the past year has been powerfully driven by an incredible boom in equipment and software investment by American firms that could dry up overnight and deal a devastating blow to an already fragile economy.


Unleash the Floodgates of Money!!!!!!!

From Bloomberg:
Six central banks led by the Federal Reserve made it cheaper for banks to borrow dollars in emergencies in a global effort to ease Europe’s sovereign-debt crisis.

Stocks rallied worldwide, commodities surged and yields on most European debt fell on the show of force from central banks aimed at easing strains in financial markets. The cost for European banks to borrow dollars dropped from the highest in three years, tempering concerns about the euro’s worsening crisis after leaders said they’d failed to boost the region’s bailout fund as much as planned.

“It’s supportive but not necessarily a game changer,” said Michelle Girard, senior U.S. economist at RBS Securities Inc. in Stamford, Connecticut. “The impact is more psychological than anything else” as investors take heart from policy makers’ coordination, Girard said.

The premium banks pay to borrow dollars overnight from central banks will fall by half a percentage point to 50 basis points, the Fed said today in a statement in Washington. The so- called dollar swap lines will be extended by six months to Feb. 1, 2013. The Fed coordinated the move with the European Central Bank and the central banks of Canada, Switzerland, Japan and the U.K.
Why did this happen?
On Tuesday evening, Standard & Poor's downgraded the long-term debt ratings of some of the largest banks in the world.

By Wednesday morning, the Federal Reserve, the European Central Bank and central banks from
Canada, England, Japan and Switzerland announced coordinated action to support liquidity in financial markets that mirrors the 2008 financial crisis.

Once banks saw their ratings downgraded, it raised the specter that they would have to post billions in additional collateral on trades just as market pressures make it hard for them to replace the funds through a stock or bond offering.
There was a rumor that a European bank had nearly failed -- which is said to be untrue.
The Interwebs are all aflame with a rumor that a European bank was about to go kaput last night, which is what inspired central banks to turn up the liquidity spigots today.

Trouble is, there’s not an ounce of evidence this is true.

The rumor is based on a blog post written at Forbes by a nuclear physicist/hedge-fund manager that is pure speculation on his part: The only reason central banks would do this, he says, is if a bank was on the verge of failure.
 Regardless of the rumor mill, the impetus for this coordinated move -- whatever it was -- can't be good; central banks don't increase liquidity in a massive move unless there is something wrong somewhere.  Period.