
The Treasury market opened higher on Thursday (a), consolidated in a triangle pattern (b) and the sold off to the 50 minute EMA (c) before rallying and consolidating until the end of the day (d). Prices gapped higher on Friday (e) and then moved higher pretty gently (f) -- there was no strong rally/

Treasury prices moved through the 50 day EMA last week, but rallied back at the end of the week.
Stock prices were stuck in a clear sideways pattern for all of Friday (a).

It's looking more and more like the dollar is forming a temporary bottom in and around current levels. Notice the increased volume possibly indicating a selling climax. Also note the 10 day EMA has been moving sideways for a bit.

Oil is still hitting resistance in the 82-84 area (A). Also note that for the last week prices have been printing some very small bars (B), indicating there has really been movement one way or the other. Finally, the MACD indicates momentum is decreasing, which makes the current market look more and more like a consolidation below key levels. But fundamentally, there is still a ton of supply, which does not bode well for future increases.
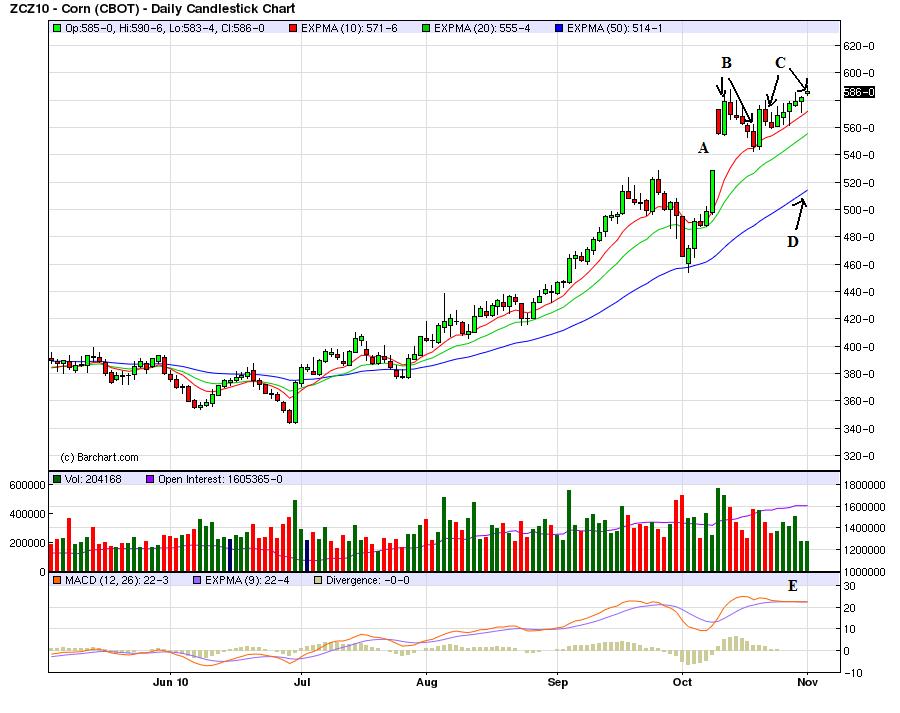
After gapping higher (A), corn prices found support at the 10 day EMA (B) and have since moved higher (C), although they are printing pretty small bars indicating a lack of strength for either bulls or bears. The EMA picture (D) is still incredibly strong with all moving higher and the shorter above the longer. Momentum is fair (E), although the MACD is near to giving a decent sell signal.