
The 10 day dollar chart shows the dollar's recent decent. Notice there were there gaps down (a, b and c) followed by two periods of consolidation (d and e).
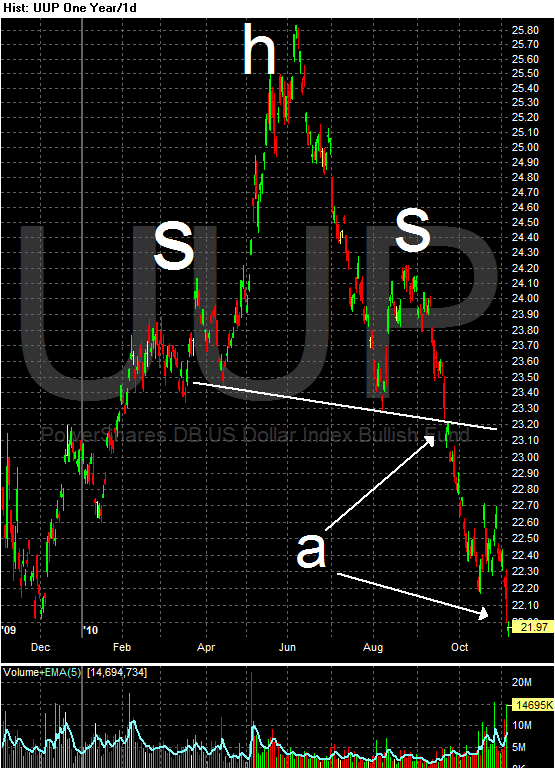
Since breaking the neckline of the head and shoulders pattern, prices have moved decisively lower (a).

Notice that as prices have moved lower, they have rallied higher on two occasions, only to find resistance at the EMA (a and b).

For the last 10 days, the QQQQs have had a slight upward bias. This is appropriate as the NASDAQ has led the market higher for the last year.

Yesterday, the SPYs moved through key resistance areas (a) -- a move that was telegraphed by the QQQQs for the last two days.

Yesterday, prices gapped higher at the open (a) and then spent most of the day consolidating gains (b). At the end of trading, prices made one last move higher on higher volume (c).