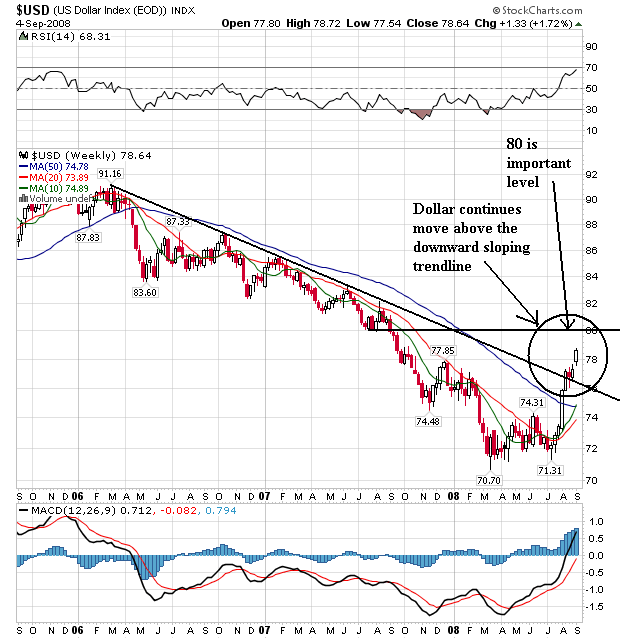
The dollar break-out continues. Notice the following:
-- Prices broke through the downward sloping trend line a few weeks ago. Then prices moved along this line for a bit consolidating gains. This week prices moved up with a gap up. That's a big move.
-- The 10 and 20 week SMAs are both moving higher
-- The 10 week SMA is above the 20 week SMA
-- The 10 week SMA is about to move through the 50 week SMA
-- It's possible to see a double bottom now. Note the first would be at 70.70 and the second would be at 71.30. I prefer double bottom to have a more pronounced space between the extremes, but that doesn't always happen.
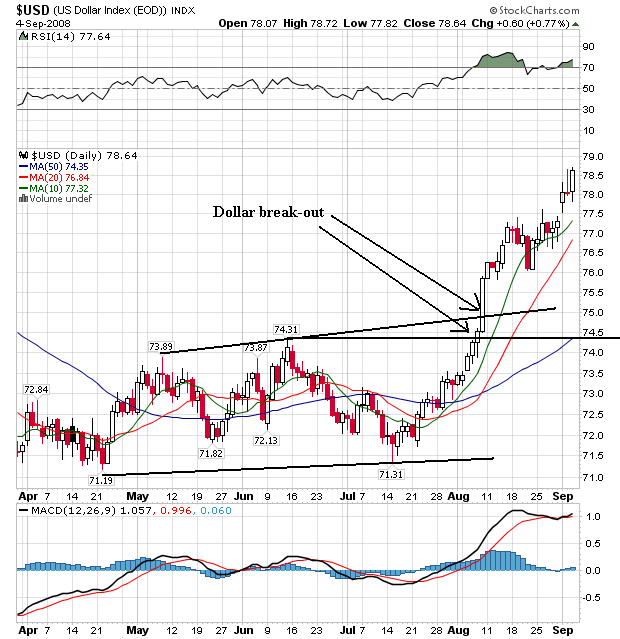
On daily chart, notice the following:
-- Prices broke through both resistance lines at the beginning of August. Note the strength of the trend break -- very strong.
-- All the SMAs are moving higher
-- The shorter SMAs are above the longer SMAs
-- Prices are above all the SMAs
-- Prices used the 10 day SMA as technical support
This is a bullish chart right now. Note on the upper chart there is strong resistance in the 80 area. Expect that to be an important technical level going forward.