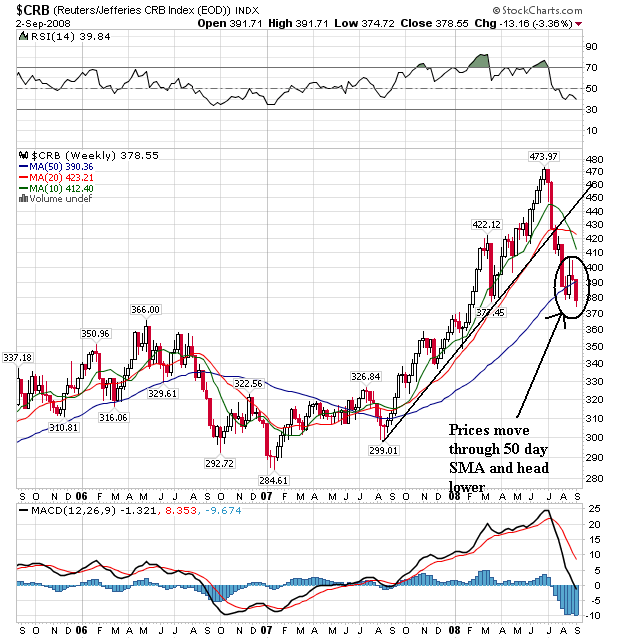
On the weekly chart, notice the following:
-- The 10 week SMA has moved through the 20 week SMA
-- The 20 week SMA is also turning lower
-- Prices moved through the 50 week SMA and now have no SMAs moving below
-- Prices are below all the SMAs
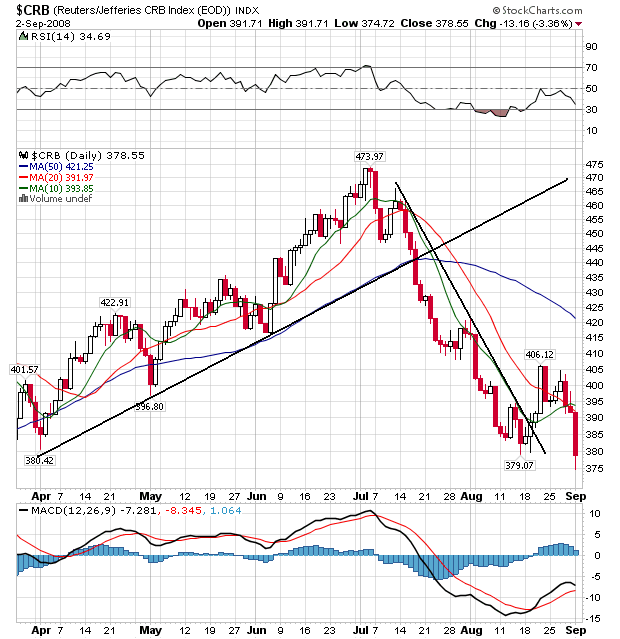
-- Prices are below all the SMAs
-- The 20 and 50 day SMA are both moving lower
-- The 10 day SMA has moved through the 20 day SMA, but with prices below all the SMAs the 10 day SMA will start to move lower soon
Long-term, this is a bearish chart. Prices are clearly moving lower and are below all the SMAs.
Short-term this is a bearish chart. Prices are clearly moving lower and the below all the SMAs
This does present some good news on the inflation front, however. That will give the Federal Reserve a bit more wiggle room.