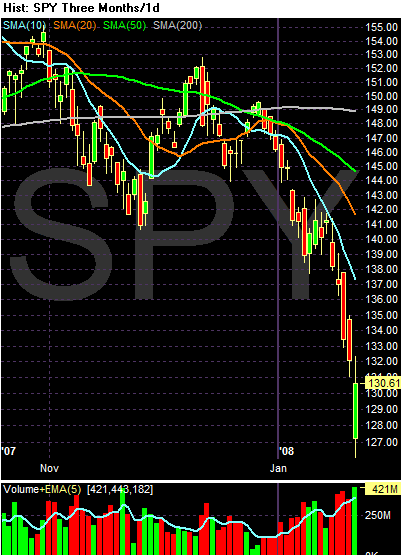
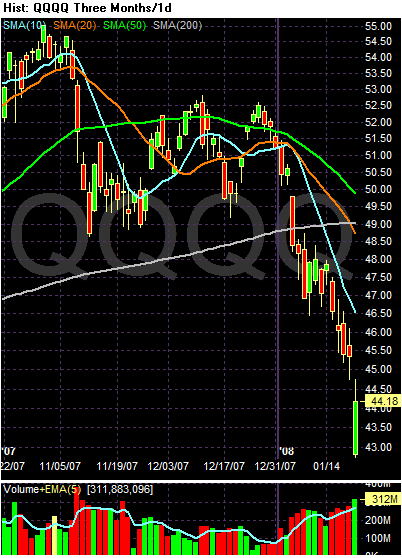
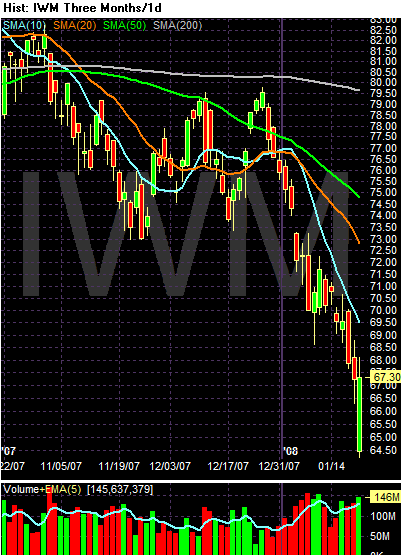
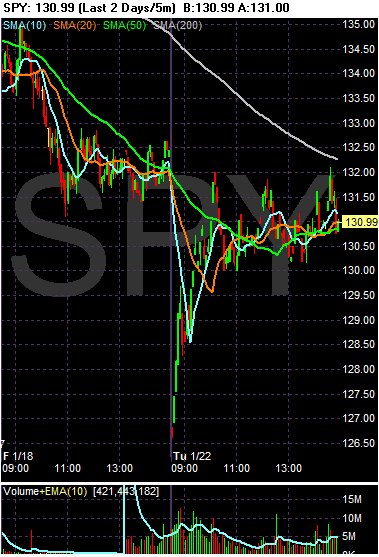
A look at the daily charts shows the Fed's rate cut worked. Although the markets opened lower ona bug gap down, all the averages spent the rest of the day rallying to fill the gap, slowly working their way back to unchanged (except in the case of the QQQQs).
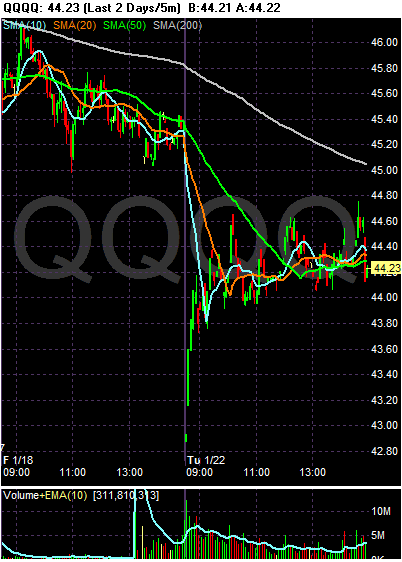
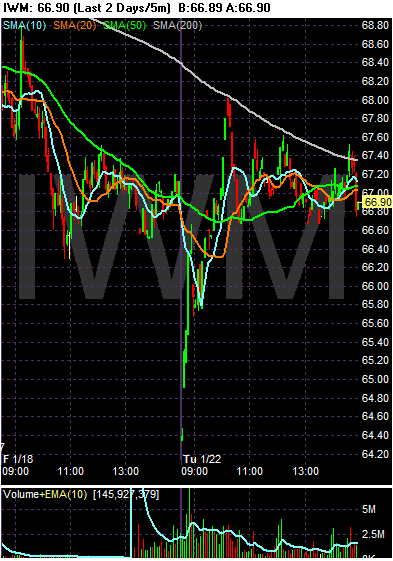
Let's take a look at the daily charts. These show the possibility that what we had today was a selling climax -- a day of heavy selling at the end of longish downturn. Only time will tell if that analysis is correct.
