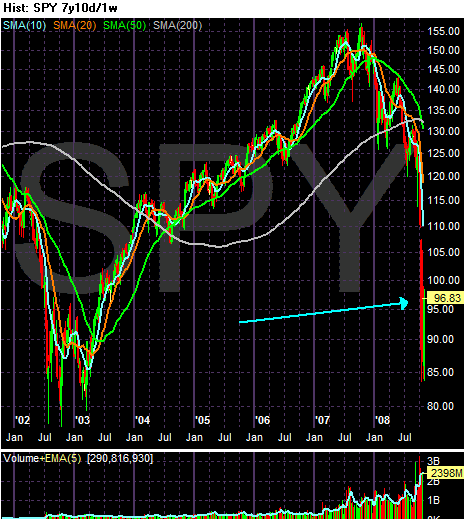
Let's begin with a long view. I always consider these to be "you are here" perspectives. Note that from 2003 - 2007 the market rallied from a low of roughly 80 to a high of roughly 155. The market has since lost 38% of its value and is currently trading at 96.83.

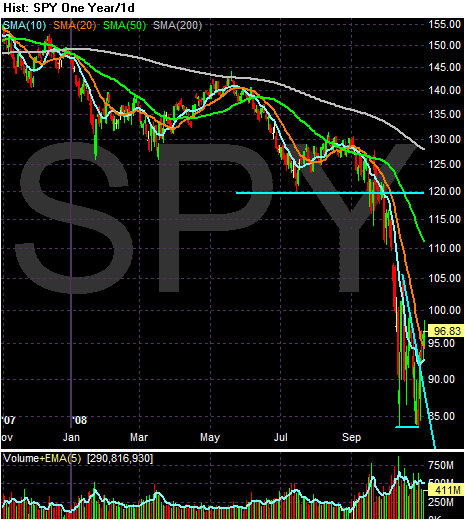
On the yearly chart note the following:
-- A large amount of the damage was done very quickly. Once the market moved through 120 it dropped to 85 withing a few months.
-- Prices are 23.75% below the 200 day SMA

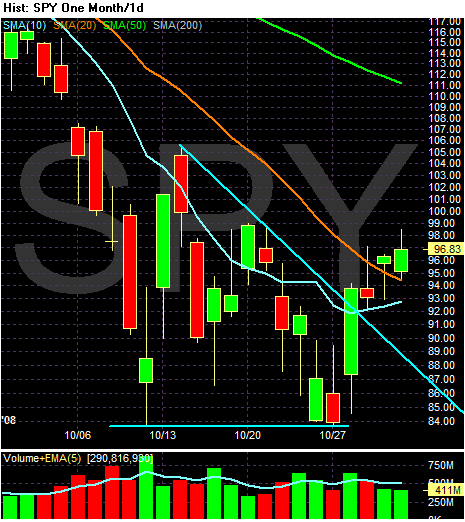
On the one month chart notice the following:
-- Prices are above the 10 and 20 day SMA
-- The 20 and 50 day SMA (the longer SMAs) are moving lower
-- The 10 day SMA is neutral and has been for about a week
-- The shorter SMAs are still below the longer SMAs
-- Prices have broken out of a triangle consolidation pattern
Bottom line: there are some promising developments here. First, prices are above some of the SMAs. Secondly the shorter SMA is now neutral. Third, prices formed a triangle consolidation pattern and then broke out. However, note the longer term indicators -- especially the 20 and 50 day SMA and their orientation to each other -- are still bearish.