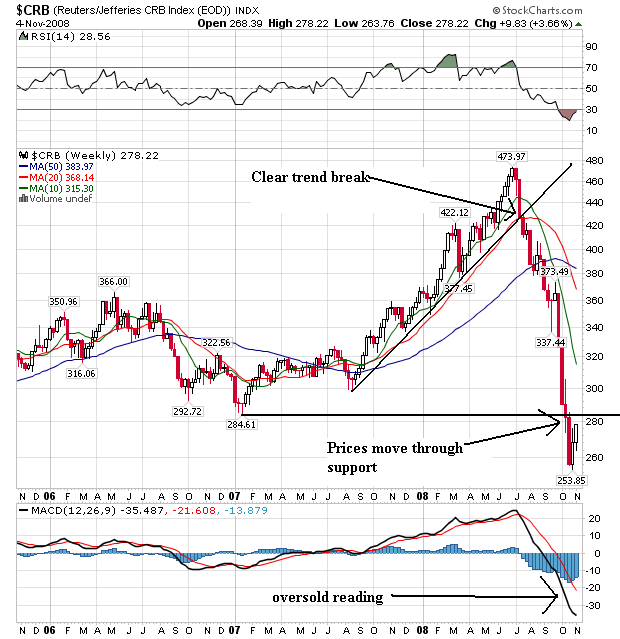
Notice the following on the weekly chart:
-- Prices clearly broke through the uptrend started in mid-2007
-- Prices are below all the SMAs
-- The 10 and 20 week SMAs have moved through the 50 week SMA
-- All the SMAs are moving lower
-- The shorter SMAs are now below the longer SMAs
-- Prices moved through support established in early 2007
-- Technically the market is oversold at this level.
Bottom line: this is a bearish chart.
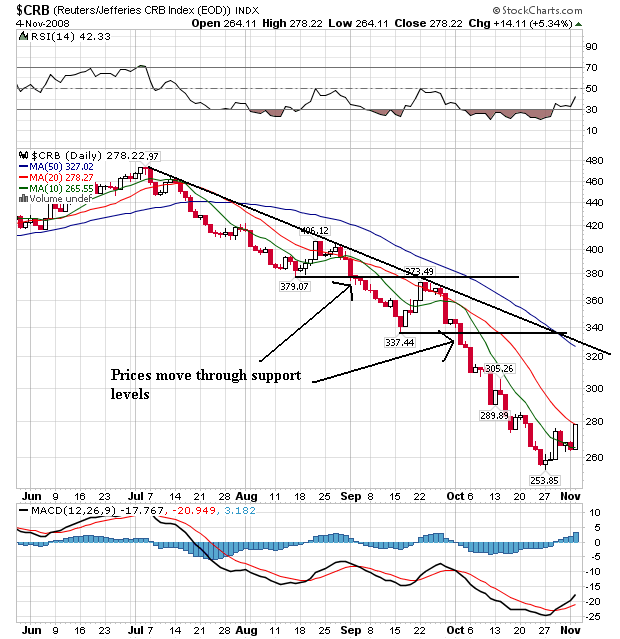
Notice the following on the daily chart:
-- Prices have been dropping for three months
-- All the SMAs are moving lower
-- The shorter SMAS are below the longer SMAs
BUT
-- The market is technically oversold right now and
-- Prices have moved through the 10 day SMA and are meeting resistance at the 20 day SMA
In other words, this could be a reversal point. However we would need to see a convincing move beyond the 20 day SMA to say for sure.