First, here is a graph of total personal consumption expenditures:

Click for a larger image
Note that this statistic has been neutral for the June - August period and it ticked down in the August to September period. In other words, the slowdown started about 4 months ago when people started to spend a bit less on things.
The report breaks expenditures down into durables goods expenditures, non-durable goods expenditures and service expenditures.

Click for a larger image
Service expenditures continue to tick up.

Click for a larger image
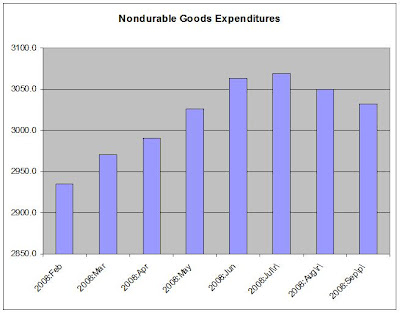
Non-durable goods rose until July but have retreated for the last two months. Remember -- these are goods that will last less than three years.

Click for a larger image
Durables goods numbers have been decimated over the last 7 months. Let's also assume that durable goods purchases are a proxy for consumer confidence. Durable goods last more than three years. Therefore, there is a higher probability a consumer will purchase these goods on credit. With credit and the job market contracting there is little reason for consumers to get into a long-term financing arrangement right now.
In other words, consumers aren't that confident right now.