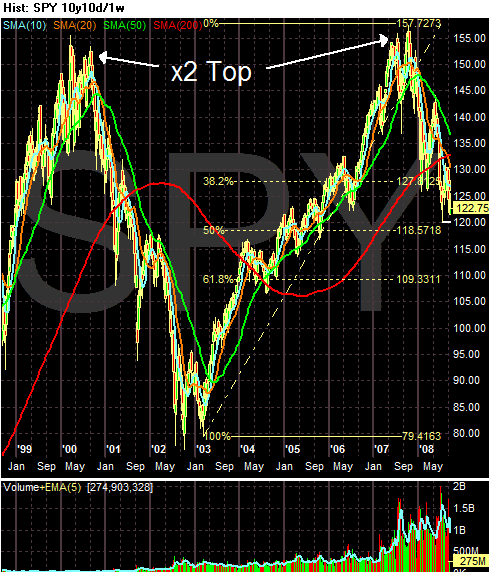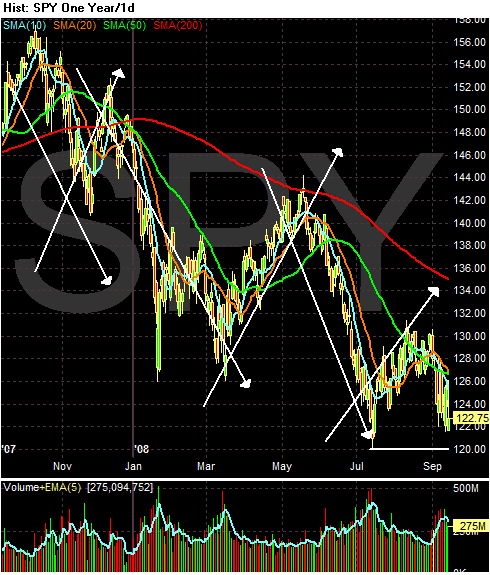
Above is a long-term (10-year) chart in weekly increments. Notice the following:
-- The market clearly formed a double top. The first one corresponds to the top of the last economy and the second one occurred right before the credit crisis started. Currently the market has touched the 50% retracement level for the rally that started at the beginning of 2003. From a technical perspective this would be a level where things should happen.
But let's assume we're about to make another downward move because the economy is about to start a second wave of downward movement (consider that employment is dropping, the rest of the world is slowing down which will slow the US export market, year over year retail sales are now negative, personal income has been dropping and manufacturing is hovering around 0). That means the double top could be a portend of a far worse market.'

On the yearly chart, notice we are clearly in a down, up down movement. Also note we've had a total series of lower lows and lowers highs.

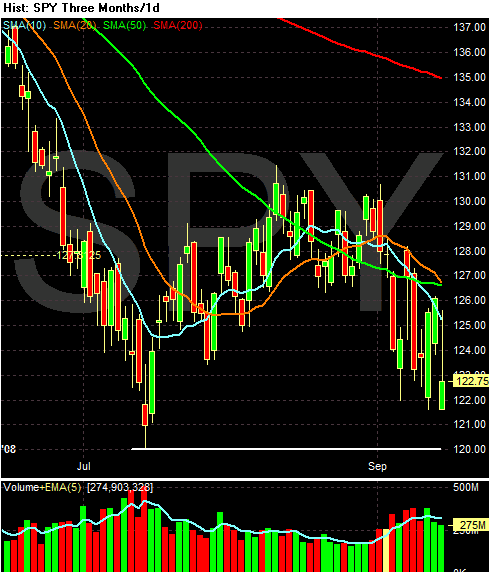
On the daily look, notice the following:
-- All the SMAs are moving lower
-- Prices are below all the SMAs
-- The 10 day SMA has moved through the 50 day SMA
-- The 20 day SMA is about to move through the 50 day SMA
-- There is key technical support at 120