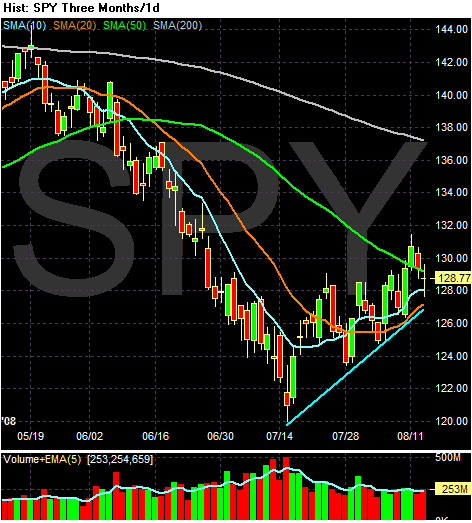
I'm going to use the daily chart today in order to clear out the noise of the day to day chart.
Notice the following:
-- Prices are still in the uptrend that started on July 15
-- The 10 and th 20 day SMA are moving higher
-- The 10 day SMA is higher than the 20 day SMA
-- Prices are running into resistance at the 50 day SMA. If they move over this level look for some upside running in the market.
However, this is still a bear market rally in action. Let's look at the longer term chart:
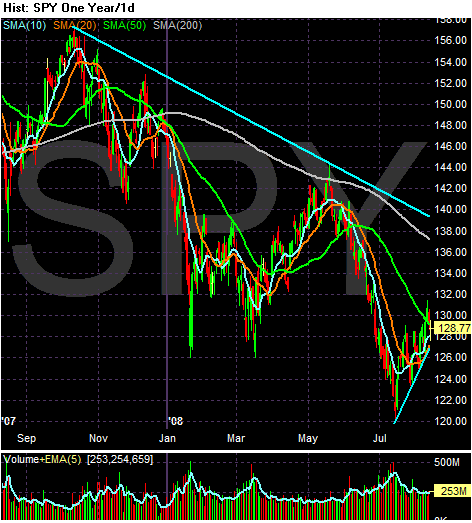
Notice we are in a clear pattern of lower lows and lower highs with the 200 day SMA providing upside resistance.