Anyway -- let's look at the long-term charts

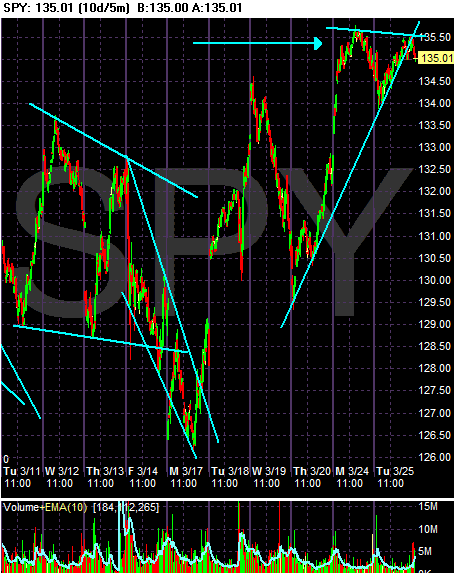
The SPYs have the most interesting 10-day chart. On the left, notice we have two triangle consolidations. The first is more level and the second is a downward sloping wedge triangle. We get a gap up on the opening of "Fed day". This was followed by a further spike up after which the market dropped hard for the rest of the day. Starting on Thursday of last week we had a rally. But if you look carefully at the SPYs (and where I added an arrow) you'll see the possibility of a double top.

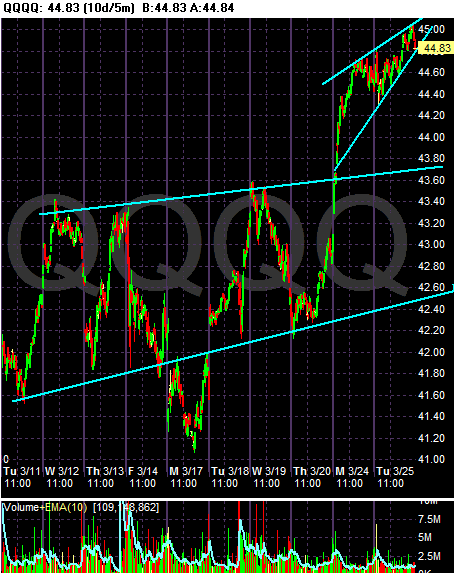
On the QQQQs we have a clear trading pattern followed by a break-out in an upward sloping wedge.

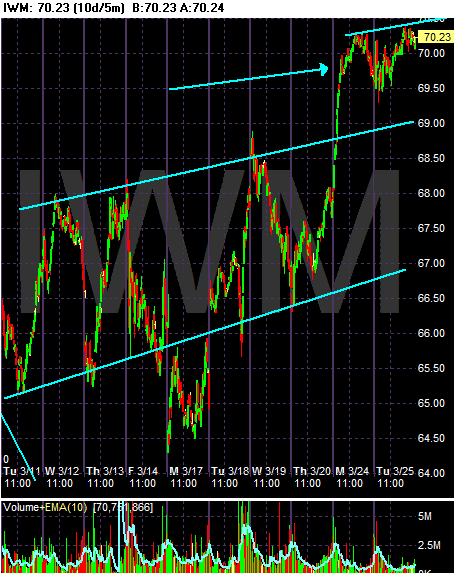
On the IWMs, notice we have another trading pattern followed by a break-out. But there is the possibility of a double top with this chart.