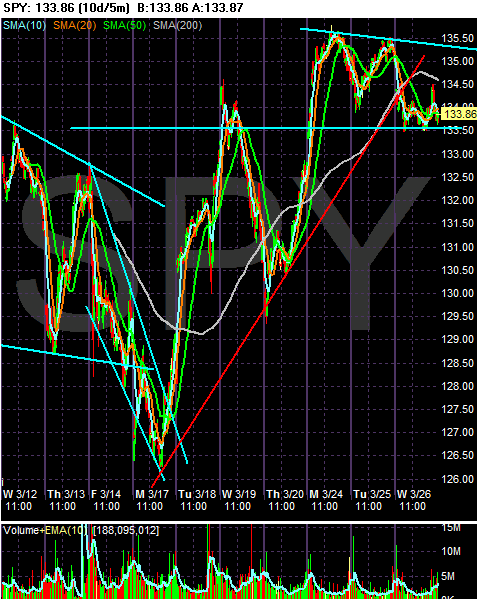
The SPYs are currently in a consolidation pattern. Note that today they broke through the trend line established a week ago Monday. But the average has been trading in the 133 - 135 range for the last three days. While there could still be a double top formation on Monday and Tuesday of this week, there is usually a stronger, sharper sell-off from that formation.

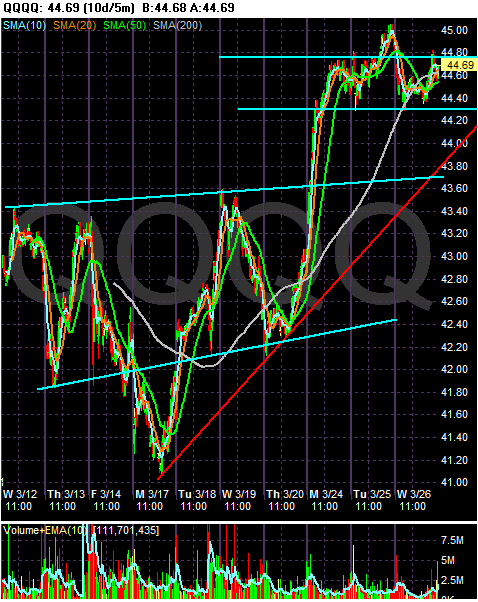
Like the SPYs, the QQQQs are essentially in a trading range between 44.40 and 45. This shouldn't be surprising considering the QQQQs were in a range for about 7 days on the chart. Also note there is still an uptrend in place that started last Monday.

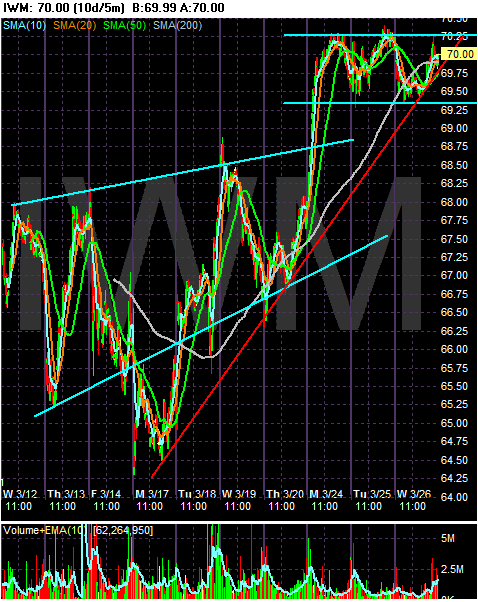
Much of the QQQQ analysis applies to the IWMs. However:
-- The average is trading between 69.25 and 70.25
-- The average is bumping up to its trend line.