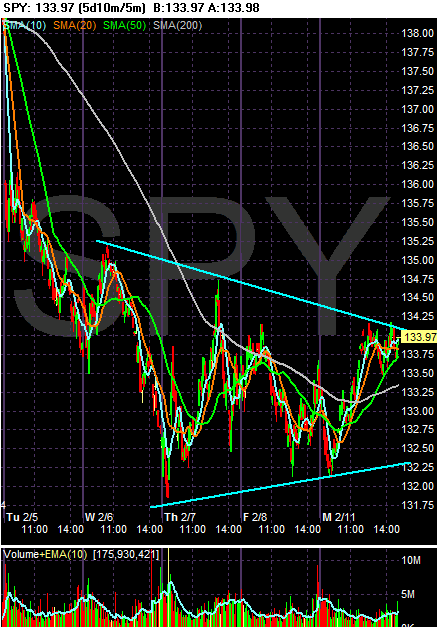
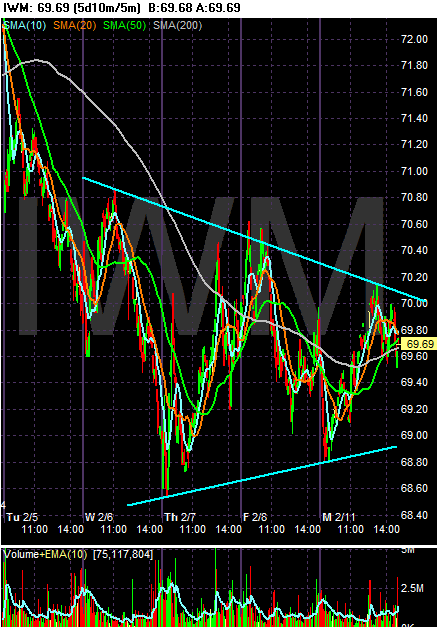
Since last Wednesday, the SPYs and IWMs have been consolidating in a triangle pattern.
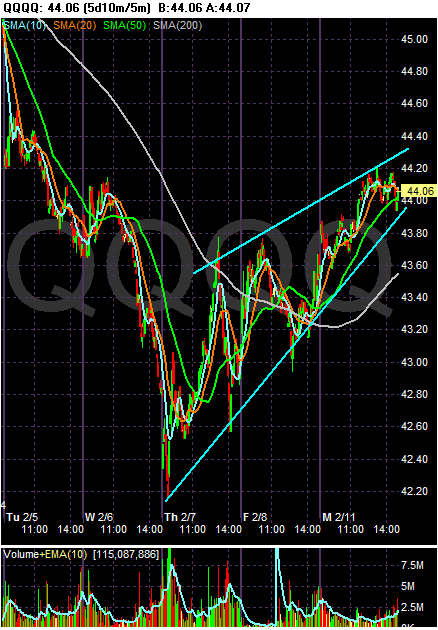
Since last Thursday, the QQQQs have been pushing up in a pennant consolidation pattern.
Now, let's pull back a bit farther to the 6 months chart. First, I still think the markets are in a bear market. That means I think we're going lower right now.
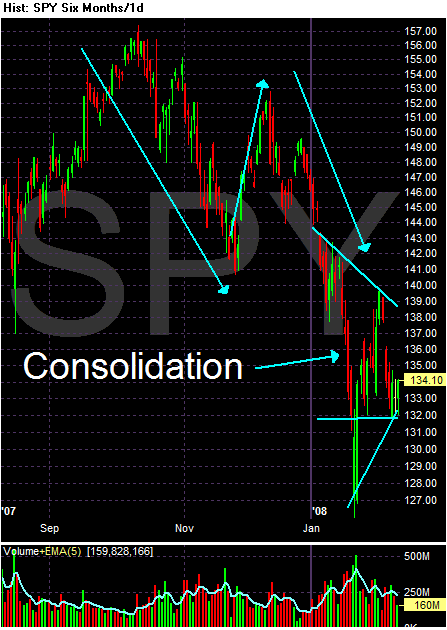
On the SPYs, notice there is a clear down up down pattern with the market also setting lower lows and lower highs. But since the beginning of 2008, we've seen the SPYs consolidate. The "technically correct" formation is a triangle consolidation. However, I don't think that's the appropriate call largely because that just looks too wide. I think the appropriate call is triangle with a straight line bottom around 132. This is entirely a judgment call, so I think it's important to keep an eye on both lines.
But, either way remember the SPYs are consolidating.
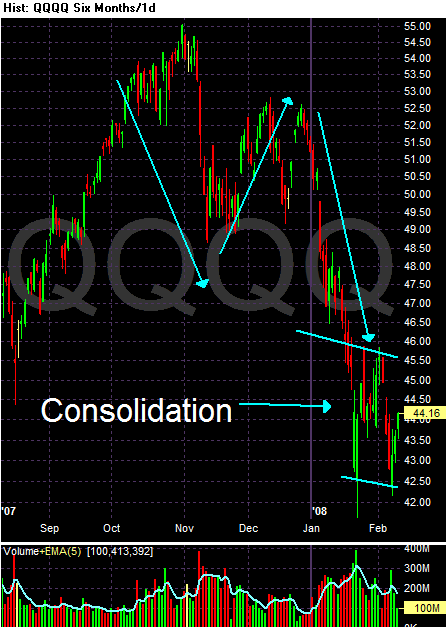
With the QQQQs we also have a down up down pattern with lower lows and lower highs. Also note we also have a consolidation pattern, this time with a rectangle pattern.
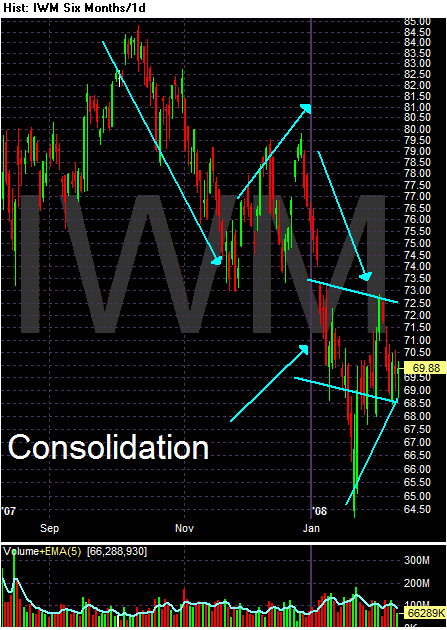
The same analysis of the SPYs applies to the IWMS, with the same caveat regarding the lower trend line.
SO -- why are the market consolidating here? Simple - we have equal competing pressures. The bears have a strong argument regarding problems in the economy. Simply put, the news for the last month or so has been terrible. However, the bulls have the Fed, which slashed rates recently.
So now the question becomes who has more staying power? Let's see what the simple moving averages (SMAs) have to say.
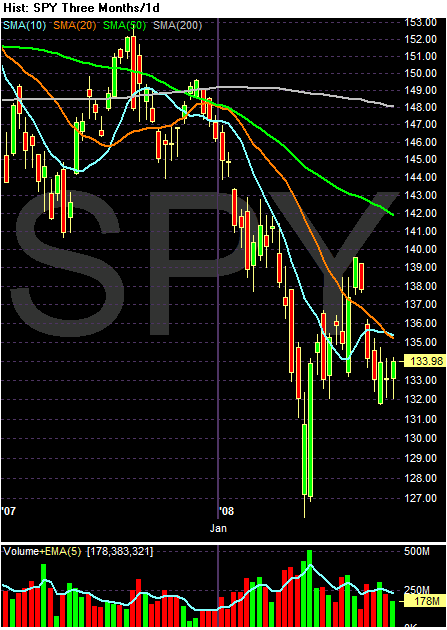
On the SPYs, note:
-- Prices are below the 200 day SMA
-- The shorter SMAs are below the longer SMAs, with the exception being the 10 and 20 area tied.
-- All the SMAs are headed lower
-- Prices are below all the SMAs
This is a bearish chart.
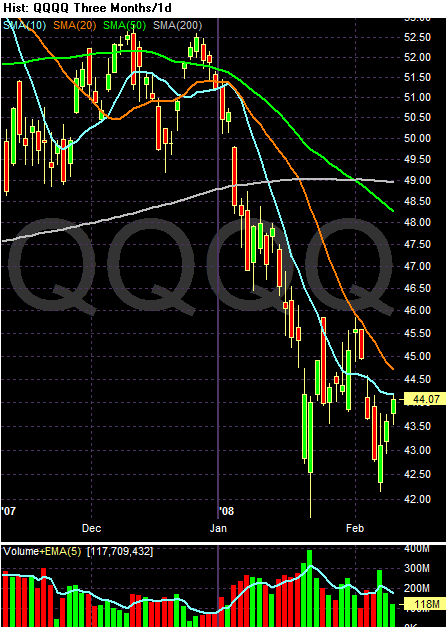
On the QQQQs, notice:
-- Prices are below all the SMAs,
-- The 10, 20 and 50 day SMA are heading lower
-- The shorter SMAs are below the longer SMAs
This is another bearish chart.
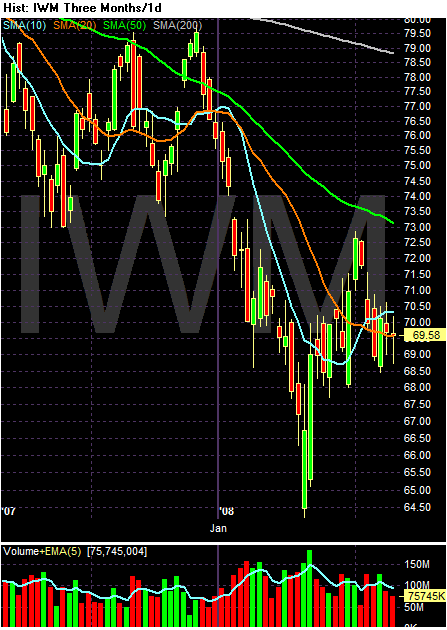
This is an interesting chart. Notice
-- The 50 and 200 day SMA are heading lower
-- The 10 day SMA is headed higher and it has crossed the 20 day SMA. This is the possible sign of a turnaround.
-- Prices are right at the 10 and 20 day SMA.
The IWMs could be showing the signs of an early turnaround. However, considering the underlying economic situation (which stinks) I don't think this is possible.
I think the bears will eventually with this, largely because there's no way the economy is gong to turn around anytime soon and we've had some Fed governors issue hawkish statements over the last few days. However -- I take Fed statements with a really large, artery clogging grain of salt.