Let's make some observations.
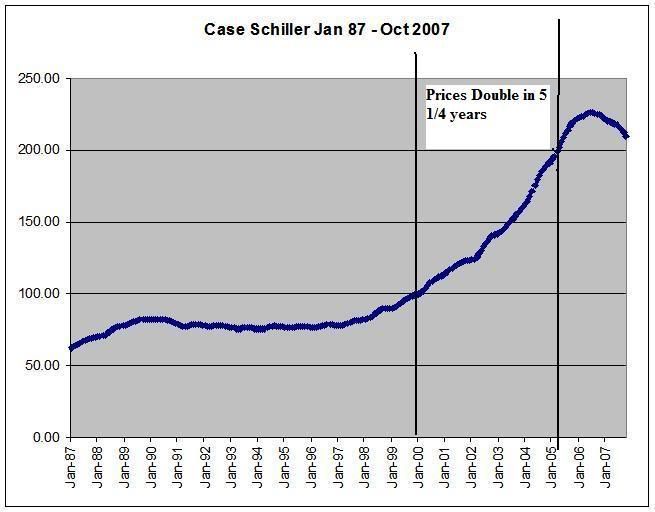
-- During a robust economic expansion in the 1990s home prices weren't that impacted. Of course, the US economy was busy creating another bubble at that time, so maybe the speculative money was entirely invested in stocks. However, there is no reason to think people didn't need houses at that time, or that the population stopped growing or that people didn't get better jobs and therefore wanted a newer or larger home. In other words, there were still fundamental reasons for home prices to increase, yet they didn't do so in an outrageous manner.
-- From January 2000 to January 2005, home prices doubled at the national level. Let's think about that for a minute and let it sink in. Now -- let's ask ourselves a question: was there a fundamental difference in demand that would warrant that increase in price compared to the previous expansion? Did the population growth rate increase exponentially? Were paychecks that much larger? The answer is -- no. In other words, there was no fundamental demand reason for home prices doubling. It was primarily the result of ultra-cheap money. The reason why this answer is so important is this: a fundamental change would create a cushion for prices, providing a price floor of sorts. But that really doesn't exist. To back up that assertion, consider this point: vacancy rates are now the highest since 1960. And vacancies didn't meaningfully increase until 2005 -- and they really moved higher at the end of 2006.
So -- are there strong fundamental reasons for home prices to remains at current levels? Not at all.
Now for the big question: how much of a decline can we expect? Well, let's eyeball the chart and say home prices are about 210 on the scale. Assuming a 15% correction, that would prices at 178.5 and assuming a 20% correction prices would drop to 168. Here is where those levels are approximately (remember, I'm eyeballing the chart)
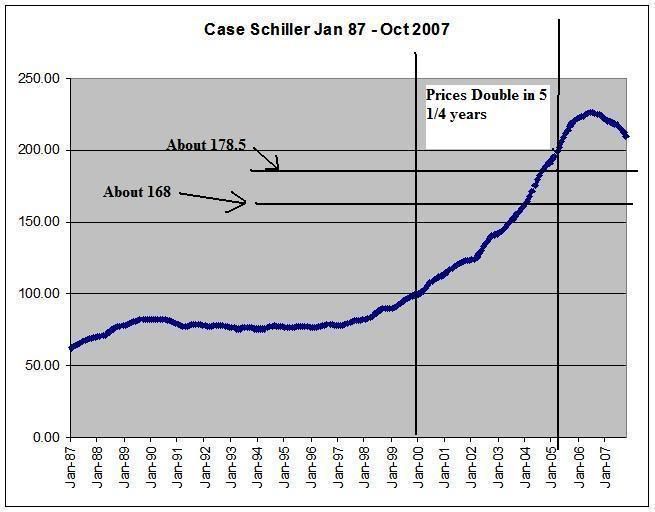
Notice how we really haven't done that much meaningful damage to the price increases from the early 2000s? The point is that a large correction -- 20% or so -- wouldn't be that hard to see given there was little reason for the price increase save for record low interest rates.