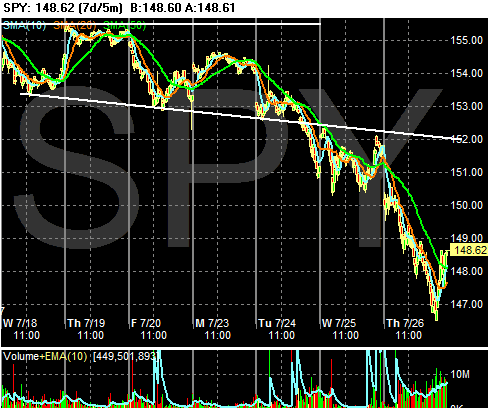
Here's a chart of the SPY in 5 minute increments going back 7 days. Notice the market tried to make new highs several times and couldn't cross the thresh hold. Also note the SPYs went through the previous support level and went down quickly from there.
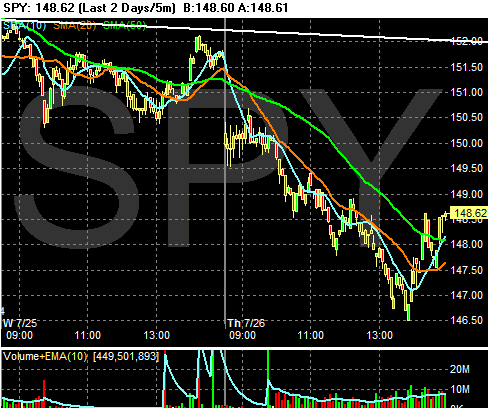
Here's a 5 minute chart going back two days to see today's action in more detail. Notice the average dropped for most of the day. There were simply no buyers in the market until right before 2 PM
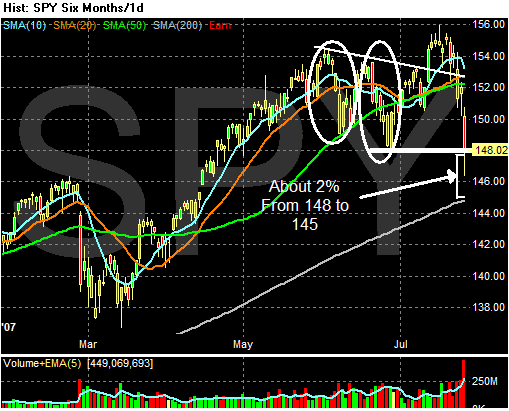
Here's the SPYs daily chart. Note there were two previous selling periods in the last 3 months. The first occurred in late May/early June and the second occurred in mid-June. This indicates there has been an underlying skittishness to the markets for awhile.
Note we are still in bull market territory because we are over the 200 SMA. Also note he have about 2% more to go before we hit the 200 day SMA. If the average hits 145, then the correction will be about 6.5%. This would be a standard market correction.
Finally, note the incredibly high action on today's selling. Lots of people were heading for the doors. In the long run, this is a good thing because it clears out the dead wood in the market. Short term, however, it's obviously very painful.
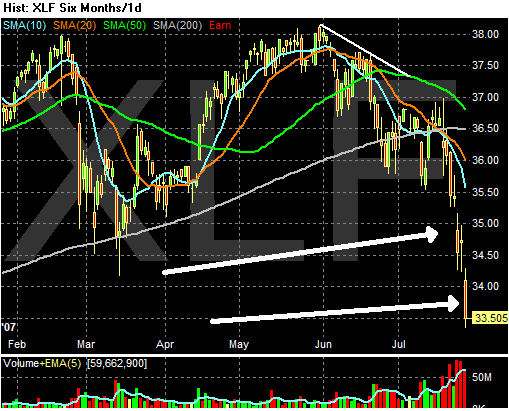
Here are two culprits. The first is the financial sector, which is basically in free fall right now. Investors are concerned about the debt markets. The CDO/CLO markets have gotten hammered lately. However, there is also concern about the health of the LBO market. The Chrysler deal may not go through. Overall financing for the recently announced LBOs is coming into question. Countrywide Financial's latest earnings announcement certainly didn't help. And the ongoing weakness in the housing sector is increasing the concerns related to foreclosures.
Note the average is below the 200 day SMA and the latest volume has been incredibly heavy.
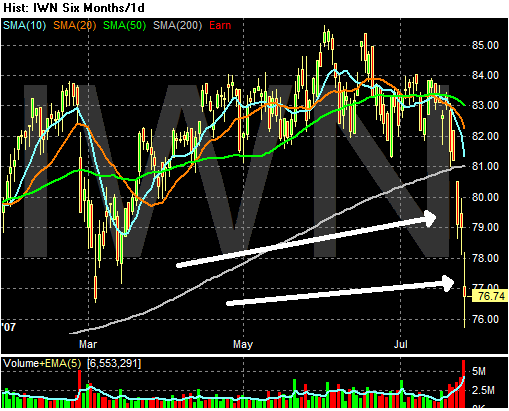
Finally, here is the IWNs -- a proxy for the Russell 2000. Investors are clearly getting out of the small cap game right now.
So -- what does this mean?
1.) The market is clearly correcting. That's a no brainer.
2.) The market sold-off about 5.5% in late February/early March after the China market sell-off. We're 1% below that level right now, so there may be some more downside room.
3.) There are a lot of questions about the health of the financial industry right now. Until those questions are resolved, the markets will be nervous.
4.) There have been some earnings concerns. Exxon's slight drop did not help. However, there have also been some good numbers as well.
5.) Tomorrow's GDP report is now doubly important to the bulls.