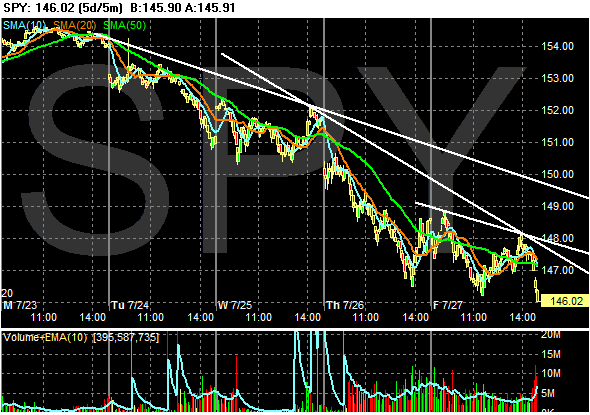
Here's a 5 minute chart that goes back 5 days. Notice the action for the whole week was down.
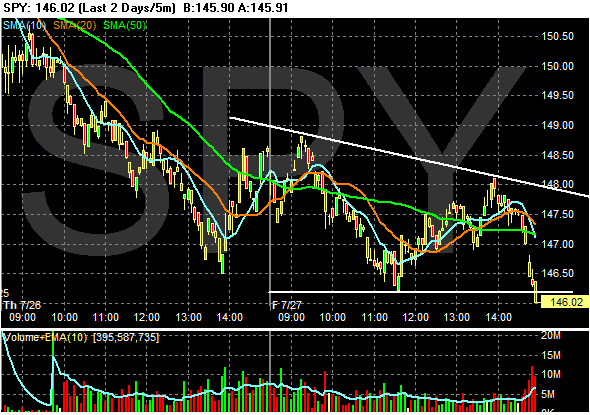
Here's a 2 day chart. Notice the end of the day sell-off on Friday (today). This shouldn't be surprising. Considering this week's action, no one wants to hold a position over the weekend.
Here's the 3 month chart of the SPYs. Yesterday I noted that a drop to the 200 day moving average would be a drop of about 2%. This would make the total point drop for this sell-off about 10 points (roughly 155 - 145) or a total of 6.45%. This would be considered well-withing the range of a standard market correction.
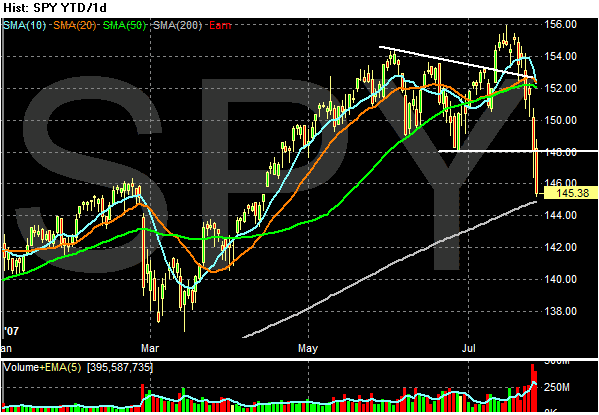
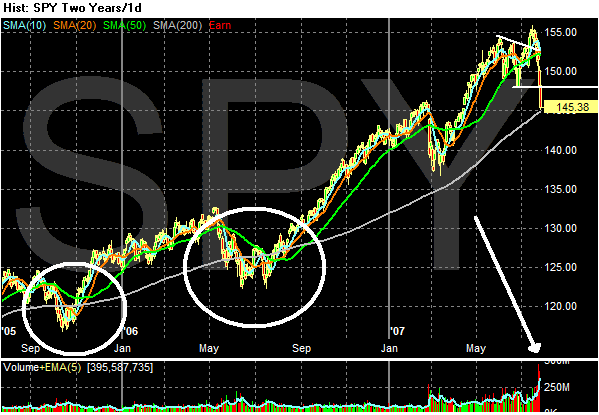
Let's take a look at the 2 year chart to see how the SPYs have performed when they previously approached the 200 day SMA. Notice it's been awhile since the average was here. Late October 2006 and June July 2006. However, the markets traded around the average for about a month and then rallied.
However, note the increased volume 1.) during the latest rally, and 2.) during the latest top. We could be seeing a selling climax right now, followed by some down time for the average.
There are a couple of problem areas that we're going to look at.
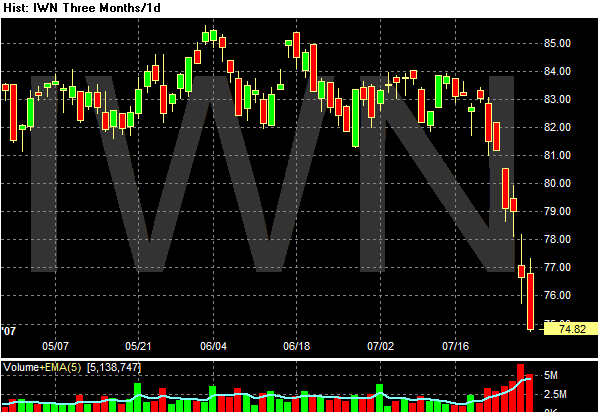
The IWNs (Russell 2000/small cap) are clearly dropping.
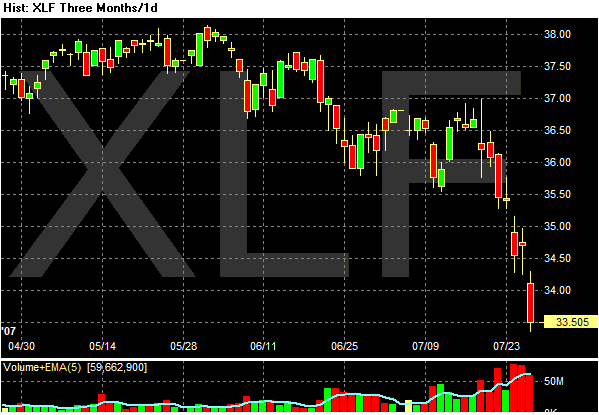
People are still bolting from the financials.
