Nonfarm payroll employment increased by 132,000 in June, and the unemployment rate was unchanged at 4.5 percent, the Bureau of Labor Statistics of the U.S. Department of Labor reported today. Employment rose in several service-providing industries, while manufacturing employment continued to decline. Average hourly earnings rose by 6 cents, or 0.3 percent, over the month.
However, the BLS revised the two previous reports higher by 75,000.
There are some big areas of concern in this report.
1.) Manufacturing lost 18,000. Most of the manufacturing indicators (such as the ISM and the various regional Federal Reserve reports) have given a positive signal for manufacturing. Yet the sector continues to shed jobs. Part of this is the increased productivity of the sector. However, I have to wonder if there is something else going on as well.
2.) Construction jobs increased 12,000. It appears commercial construction projects are absorbing the loss of jobs in the residential construction area.
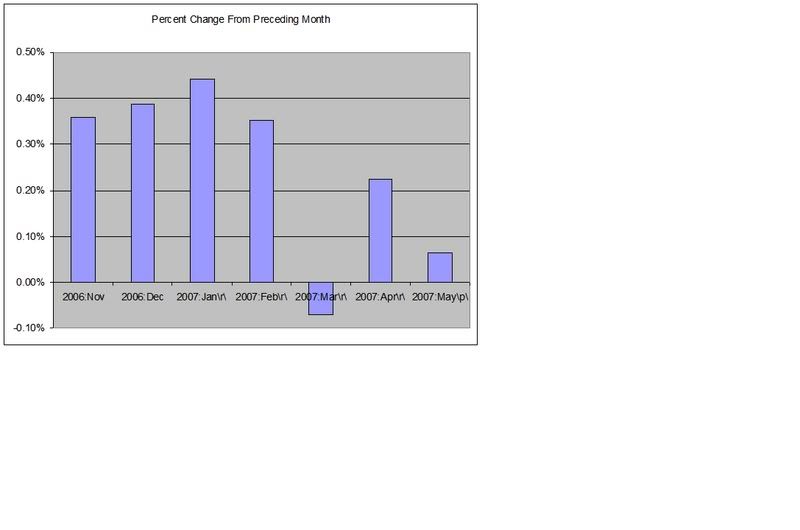
3.) Retail lost 24,000 jobs. This is further confirmation of a slowdown in consumer spending. Here is a chart of chained 2000 dollar month over month increases in personal consumption expenditures for the last 7 months. Notice that sales have slowed the last three months.

4.) Education/health services added 59,000 and leisure/hospitality added 39,000. Neither of these areas are considered high-pay areas. Regarding health services, note where the jobs were created:
Health care employment grew by 30,000 in June, with gains in hospitals (+14,000) and in nursing and residential care facilities (+8,000).
5.) Professional and business services lost 9,000 jobs. The report notes the slowdown in this area:
Professional and business services employment was little changed in June. During the first 6 months of 2007, job growth in the industry averaged 13,000 per month compared with an average of 42,000 per month in the last half of 2006.
Employment growth is one of the bullish arguments for the economy going forward. If the headlines focus only on top-line growth, this report should help although it is not a blockbuster. However, looking at the details a different picture emerges: Slowing retail and professional services growth, the continued decline in manufacturing and a big addition of lower-paying jobs.


6 comments:
This is a poor number, during the mid 1990's the economcy created +200,000 per month. this does not compare. Also, only 92,000 jobs were created in the private sector, and we need + 150,000 jobs to keep up with the population growth.
Some retail jobs will disappear as internet sales take a larger share of the shopping dollar.
I had on CNBC while reading the paper and heard that there was a great number for the payrolls. Then when I turn on the computer and read, the number doesn't look that wonderful to me?? Geeze, they keep hyping this stuff. When will reality set in?
I thought it was a pretty strong report, especially the past revisions.
However, the day that government, health, and education workers are leading indicators is the day I'll eat my hat.
In short, economy is running ok right now probably 3% GDP this quarter or more, but watch out manufacturing and employment services ARE leading indicators.
md
Bonddad:
I would be very interested in your personal views of the integrity and honesty of the monthly employment numbers from BLS in light of the Birth/Death model that was fully implemented in the figures around June, 2003. Up until that approximate date, the monthly employment numbers were going down almost every month since Bush took office. Since that model was fully implemented, just the reverse has happened.
The impact of this model has been even more striking this year. The employment increases over the past 5 months have been (beginning with February) +90k, +175k, +122k, +190k and +132k, for a total of +709k jobs. However, INCLUDED in those numbers were the "jobs" estimated by the Birth/Death Model for the same period of +118k, +128k, +317k, +203k and +156k, or a total of 922k jobs due to the Model alone. This says that the jobs actually reported by businesses and grossed up (i.e. the "real" jobs) over the same period were -28k, +47k, -195k, -13k and -24k, for a total job "growth" of -213k.
The Model alone added 153,000 jobs in construction over the past 5 months, 132,000 jobs in professional and business services and a whopping 324,000 jobs in leisure and hospitality in the last 5 months, and that's JUST FROM THE B/D MODEL!!! Forgive me for being just a little bit skeptical, but after seeing evidence of the politicization of almost every federal governmental agency in the past few years, plus numerous examples of mendacity in numbers developed by various agencies (the cost of the war, the cost of the Medicare Part D benefit, the numbers associated with the effort to privatize Social Security, the true budget deficit, etc., etc.), I really have little faith in the "robust job growth" in our economy
I don't believe those numbers. How can construction jobs increase when there is a 20% decrease in new home sales? Are they counting all those illegal immigrants? Aren't they the first to get laid off?
Post a Comment