Showing posts with label ism manufacturing. Show all posts

Thursday, August 8, 2013

Will the Second Half Print Strong Growth?

There's a lot of very conflicting information on the US economy right now.  On the negative side we have the sequester and the potential for yet another government shutdown or threat thereof.  Wage growth is weak, higher interest rates are hurting the housing recovery and the employment situation is marginal at best.

But two reports last week hint at a far stronger economic environment in the second half.  Let's start with the ISM manufacturing report.

The PMI™ registered 55.4 percent, an increase of 4.5 percentage points from June's reading of 50.9 percent. June's PMI™ reading, the highest of the year, indicates expansion in the manufacturing sector for the second consecutive month. The New Orders Index increased in July by 6.4 percentage points to 58.3 percent, and the Production Index increased by 11.6 percentage points to 65 percent. The Employment Index registered 54.4 percent, an increase of 5.7 percentage points compared to June's reading of 48.7 percent. The Prices Index registered 49 percent, decreasing 3.5 percentage points from June, indicating that overall raw materials prices decreased from last month. Comments from the panel generally indicate stable demand and slowly improving business conditions."

What is particularly encouraging here are the internals; new orders jumped 6.4 points and the overall production index increased 11.6 points.  Usually these numbers increase in far smaller increments. Also of importance is the fact that 13 of 18 industries are reporting an higher activity.  Let's take a look at the anecdotal comments from the report:
  • "Business conditions remain stable, possibly improving somewhat in future months." (Miscellaneous Manufacturing)
  • "Housing market continues to improve, leading to increased demand in product." (Electrical Equipment, Appliances & Components)
  • "Overall conditions remain steady and slightly above prior year." (Paper Products)
  • "Sales are holding steady. Business is good." (Furniture & Related Products)
  • "Business is slow compared to previous years." (Computer & Electronic Products)
  • "First half [of 2013] is better than last year — steady, slow improvement." (Printing & Related Support Activities)
  • "Leading indicators continue to show stagnant-to-gradual improvement, and sales across the board continue to be flat." (Machinery)
  • "Economy continues to be relatively flat. Growth in China is holding. Europe staying at a low level, and U.S. just flat." (Transportation Equipment)
  • "We see gluten-free industry to be strong and it continues to grow. We also see the need for capacity in blending operations." (Food, Beverage & Tobacco Products)
  • "Business remains flat. Looking for some seasonal bump as we come to the beginning of our 'busy' time." (Chemical Products)
The vast majority of the comments are positive; only computer and electronic parts, transportation equipment and chemical products are slow.

Here's a graph of the overall data:


 The chart above shows the overall trend for manufacturing was decreasing for about a year, with several recent readings below the 50 line the delineates between expansion and contraction.  However, the latest reading is incredibly strong relative to the recent trend. 

Let's turn to the services index:

"The NMI™ registered 56 percent in July, 3.8 percentage points higher than the 52.2 percent registered in June. This indicates continued growth at a faster rate in the non-manufacturing sector. The Non-Manufacturing Business Activity Index increased substantially to 60.4 percent, which is 8.7 percentage points higher than the 51.7 percent reported in June, reflecting growth for the 48th consecutive month. The New Orders Index increased significantly by 6.9 percentage points to 57.7 percent, and the Employment Index decreased 1.5 percentage points to 53.2 percent, indicating growth in employment for the 12th consecutive month. The Prices Index increased 7.6 percentage points to 60.1 percent, indicating prices increased at a significantly faster rate in July when compared to June. According to the NMI™, 16 non-manufacturing industries reported growth in July. Respondents' comments are mostly positive about business conditions and the overall economy."

As with the manufacturing index, we see large increases in the internals with large jumps in overall activity and new orders.  Employment did drop, but it was still in positive territory.  And the breadth of the increase is impressive with 16 industries reporting growth.

Let's turn to the anecdotal part of the report:
  • "The economy seems to be getting stronger with commodity prices increasing." (Information)
  • "Sequestration and healthcare reform causing uncertainty and lower revenues." (Health Care & Social Assistance)
  • "Business orders continue to grow, but at a slow pace. We are seeing growth in areas where we have been flat for many months. Economy seems to be stabilizing in some areas and heating up in others." (Professional, Scientific & Technical Services)
  • "The auto industry continues to be strong, and we expect it to continue throughout 2013." (Retail Trade)
  • "Competitive environment remains challenging." (Accommodation & Food Services)
  • "Local business continues at same pace as last year. Capital investment continues to be positive." (Wholesale Trade)
As with the manufacturing report, the overall tenor of most comments is positive. We see a negative contribution from political and regulatory developments along with concerns related specifically to the hotel and restaurant industry.

Here's a graph of the data:


The service industry has been far steadier over the last few years, consistently printing numbers above 50 with little indication of a move into contraction.  However, the latest print is very strong.

Let's combine the above information with this statement from Dr. Ed:

My “Second Recovery” scenario is playing out nicely this year as rising auto and new home sales boost manufacturing and the overall economy. Railcar loadings of motor vehicles rose to another cyclical high in mid-July. This series is highly correlated with auto sales. The same goes for railcar loadings of lumber and wood products, which is highly correlated with housing starts. 

Auto sales numbers have flown below the headlines for the last few years, but the overall pace has been continually increasing:


Now auto sales are just below the average level they maintained during the last expansion.

The housing story may be starting to fade as higher interest rates may be slowing sales of both new and existing homes.

In reality, I remain very sanguine about the economy.  Every time it looks like we're about to kick into a higher gear, we see an extraneous event perpetrated by the the Republicans in Congress that hinders growth.  It started with the near default of US debt two years ago followed by the S&P downgrade, was followed by last year's sequester and will probably continue this year with yet more high level conservative budget stupidity.   And while the recent ISM numbers are very encouraging, they are in fact only one month worth of data and need to be understood as just that.  It's just as possible that next month we'll be disappointed with a far weaker than anticipated read. 

However, the numbers printed above highlight that -- yet again -- the economy appears to really want to grow faster.  Both primary sectors of the economy are printing strong numbers and auto sales are solid, indicating there is a certain level of consumer confidence in the market.  And while housing may be weakening due to higher interest rates, it's highly doubtful it will crater anytime some.  It's also possible that as the market adjusts to the new "higher" levels, they'll realize they aren't in fact that high and will still attract buyers in the market.  And finally, with the UK mending and the EU probably coming out of recession, it's likely that we'll see a rise in export orders which will obviously help the US economy, albeit it around the fringes. 

But, frankly, I'm expecting another round of Washington stupidity after the August recess that will put the kabash on the whole thing. 


Tuesday, February 7, 2012

Hussman's recession call is still not validated

- by New Deal democrat

Last week I wrote that both ECRI's initial recession call and also John Hussman's recession warning criteria had been invalidated. Oversimplifying somewhat, Hussman's 4 crieteria were: (1) credit spreads wider than 6 months before; (2) the S&P 500 lower than 6 months before; (3) the ISM manufacturing index under 54 simultaneously with less than 1.3% YoY employment growth; and (4) a yield curve of less than 2.5%. As of last Friday, not only was the S&P not lower than it was 6 months before, it was actually at a 6 month high! Further, not only was the ISM manufacturing index above 54, but employment growth was also more than 1.3% higher YoY. I've also pointed out that the yield curve element of Hussman's formula was in place for twenty years running during the 20th century, simultaneous with the strongest GDP growth in the last 100 years.

In closing, I said that Hussman should at least explain why he believed his recession call was still valid. Put another way, what is the "off" switch for the above criteria, if it is different from the "on" switch?

This week Hussman spent a large part of his weekly market comment defending that call. His defense rests, as I understand it, on two grounds: (1) one or more criteria was violated in 2008 and the recession warning, obviously, was still valid; and (2) there is no "off" switch for the criteria, but rather, once "on," a cornucopia of bearish evidence may be invoked, and entirely different criteria, e.g., a positive ECRI growth WLI, signals the end of recession.

Before I go further, I should emphasize that Hussman defended his metrics on their merits, with no ad hominem attack on me. For my part, although I still disagree with him, he did make some valid points, and none of what follows should be taken as a personal attack on him. In fact, I think his shorthand indicator briefly summarized above is very helpful.

That being said, idea of an indicator that switches "on" but never "off" strikes me as not intellectually rigorous. Beyond that, if the ECRI indexes are the determinant of an indicator, I should just go directly by them and cut out Hussman as the middleman. That in the interim a cornucopia of evidence may be selected (cherry-picked?) in support of a conclusion strikes me as inherently subjective and unreliable.

Since I wasn't satisfied with Hussman's explanation, I decided to examine the 3 non-yield curve criteria on my own to determine what should cause them to switch from "on" to "off." (With long term yields under 2.5%, that element is likely to remain in effect for a long time to come). The results indicate that if a recession were to happen now, it would still be unprecedented under Hussman's own criteria.

As an initial note, Hussman's claim that the S&P 500 criteria was violated in May 2008 is not correct. The closest it came was 1426.63 on May 19, 2008, only 7 points below its level of 1433.27 on November 19, 2007. That being said, my research indicates that it is not uncommon at all for that index to be higher than 6 months previously either shortly before or after the onset of a recession. Similarly, it is not uncommon for credit spreads to meander higher or lower than 6 months before during all but the most serious economic turns.

What is uncommon -- in fact, almost non-existent -- is for either the ISM manufacturing index criteria or the employment criteria to be violated. Generally speaking, once the ISM index falls below 54 in advance of a recession, it continues to fall under 50 and only rises back above 54 after the recession is over. Similarly, once job growth falls below 1.3% in advance of a recession, it typically only rises back above that level well after the recession has passed.

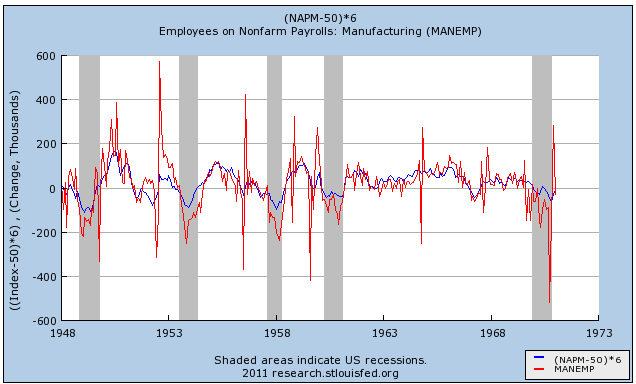
In fact, each has occurred only once, and not simultaneously. In particular, in all cases but one, the YoY employment percentage change was falling on a 6 month smoothed basis in advance of every recession since the second world war. The sole exception was in 1953. Similarly, the only time the ISM index fell below 54 within 1 year of the onset of recession but rebounded back above it was in 1959 for two months. These are shown in the graph below (in which the ISM index is normed so that a reading of 54 on the index = 0, and payroll YoY% growth is also normed so that 1.3% YoY growth = 0):


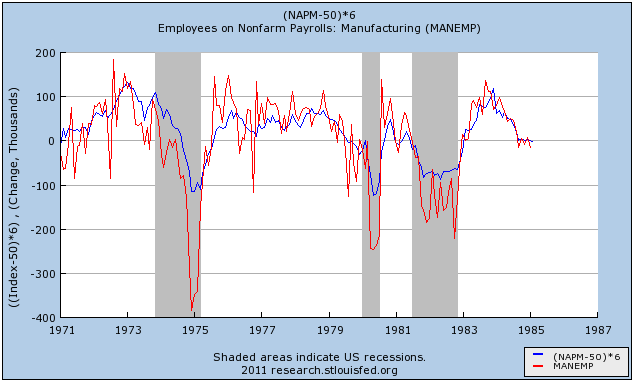
To show you the full record, here is the same graph for the 1970s and early 1980s recessions:


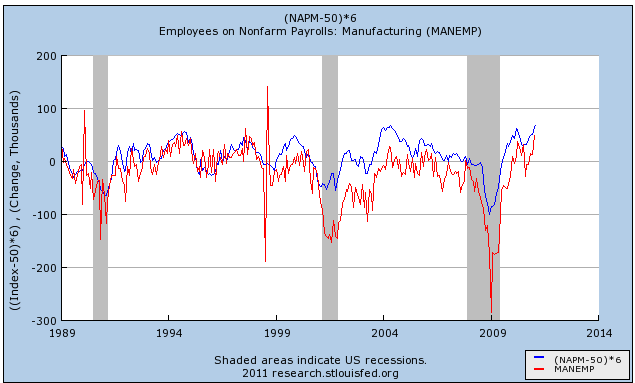
And here is the same graph from 1989 to the present:


Note that in every other case, not only did the ISM index continue to fall, but the YoY% change in employment was also declining going into a recession. There is simply no precedent for a recession occurring while both the YoY% change of employment is improving, and simultaneously the ISM index rebounding above 54. Put another way, whether a recession happens or not, under the set of criteria Hussman himself has established, a precedent will be set. Only in retrospect will we know the answer.

Thursday, March 3, 2011

More on strong manufacturing vs. weak manufacturing jobs

- by New Deal democrat

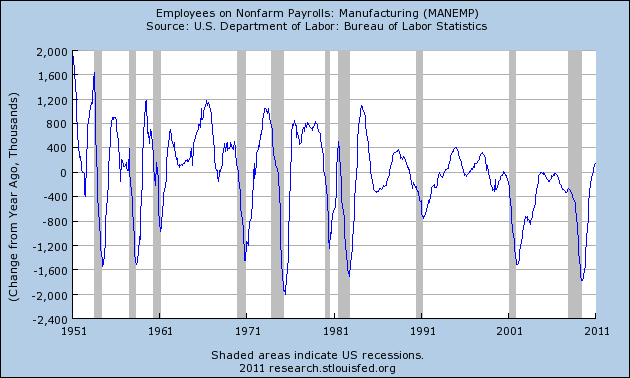
I have been trying to compare how economic strength has translated into jobs in recoveries past, vs. the present recovery. After putting up yesterday's post on the ISM index, I found a more dramatic way to illustrate the point. This first graph shows the year over year change in the absolute number of manufacturing jobs over the last 60 years:


As you can see, coming out of recessions, from the end of World War 2 until the early 1980s, it wasn't uncommon at all for 800,000 manufacturing jobs or more to be added in the first year of a recovery. But in real terms it is even more dramatic than that, because in 1950 the US population was half what is is now; in the 1970s two-thirds; in 1982 three-quarters.

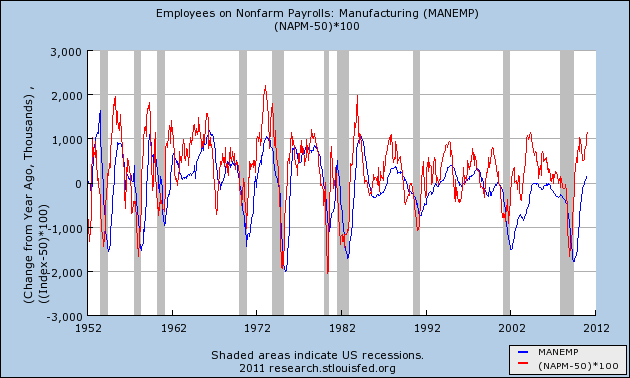
Now let's overlay the ISM manufacturing index on that prior graph:


In February we had the highest reading (save for one equal reading in 2004) since 1983. Yet the same amount of manufacturing expansion gave us only 150,000 new manufacturing jobs year over year.

So the comparison of equivalent strength measured by the ISM vs. actual manufacturing job growth, adjusted for population, looks like this:

1950s 1,600,000
1970s 1.200,000
1982 1,067,000
2010 150,000

I'm not exactly sure how the ISM survey phrases its questions, but I do not think they are asking the survey participants if they plan to expand in China. In other words, I believe the questionnaire deals solely with expansion in the US.

This effectively removes offshoring of jobs as a reason for the startling paltry number of jobs added - rather, it looks like this is all about automation. In recessions, manufacturers have been letting people go. In recoveries, they have been hiring new machines.

As a result, despite the great recovery of the US manufacturing sector, in terms of jobs creation it has come up over 1,000,000 jobs short compared with even 30 years ago.

Wednesday, March 2, 2011

ISM Index suggests ~+57,000 new manufacturing jobs in February

- by New Deal democrat

As Calculated Risk pointed out yesterday, the ISM manufacturing report was an upside blowout, the strongest such report in several decades by some measures (the contrary "poor analysis" mentioned by CR was almost certainly the spin by the Doomorons at Zero Hedge. Google it if you feel you must). And Bonddad and I have separately written recently that the manufacturing sector has been exceptionally strong.

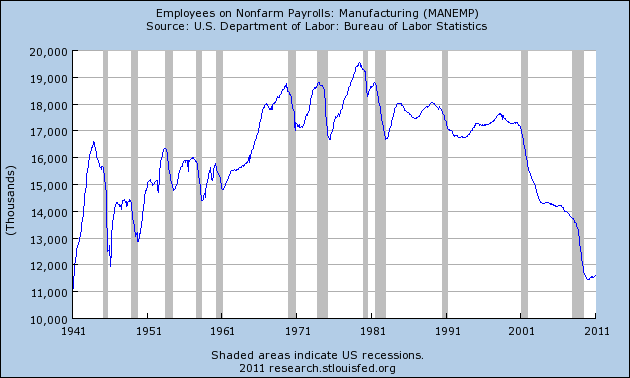
An important question is, how much does that translate to in terms of jobs? The ISM report is a diffusion index, meaning it measures expansion vs. contraction. Any number above 50 in any of its indexes means expansion, and visa versa. But like any data, it has shortcomings. All else being equal, with a population increase from 200 million to 300 million, an equivalent reading ought to suggest 50% more monthly hiring in the latter period than the former. But on the other hand, we know that due to efficiency and offshoring, the number of persons employed by manufacturing has fallen by 40% since the peak in 1979, as shown in this graph:


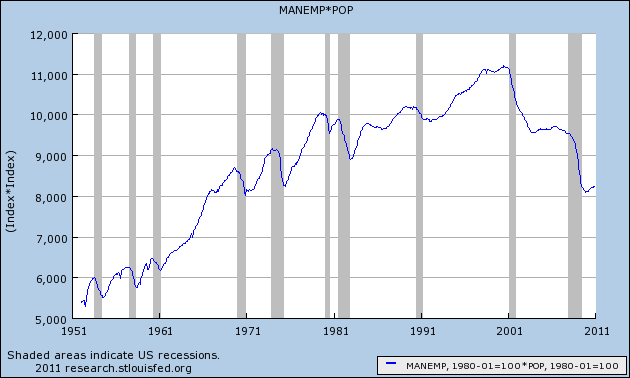
These crosscurrents suggest that the "real" effect of an equivalent ISM number on employment over time would look something like this graph, in which the number of manufacturing employees is multiplied by population (with 1979 = 1):


(BTW, admittedly this is not a true representation, since we would want to visit an alternate universe where either population was held constant or there were no efficiency gains or offshoring, but presumably you get the drift)

When I went to look at the data, I expected there to be both more hiring and firing over time, due to population increases, compared with equivalent ISM readings. That wasn't the case. In fact, since the ISM started publishing data in 1948, up until about 1999, the amount by which an ISM reading exceeded 50, multiplied by 6 (thousand), gave you an excellent idea of what manufacturing job gains were during the same month. Here is the period of 1948 through 1970:


Here it is for the severe recessions of the 1970s and 1982:


And here it is from 1989 to the present. Note that the red line (manufacturing jobs gained/lost per month, in thousands) no longer keeps up with the blue line (the ISM manufactuing index with equilibrium reset from 50 to 0 for easy comparison) after 1998:


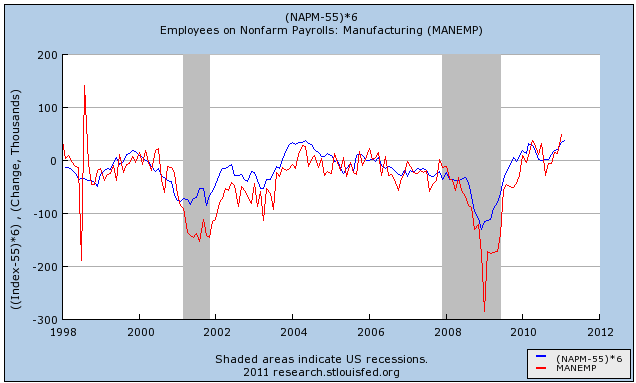
In fact, there is an excellent fit since 1998, but it involves resetting the equilibrium point at 55 instead of 50. In other words, subtract 55 (instead of 50) from the ISM reading, and multiply by 6 (thousand) and for the last 10+ years that will give you a very close approximation to the number of manufacturing jobs added that month:


February's ISM manufacturing index reading was 64.5. This is 9.5 above 55, multiplied by 6000, tells us that about 57,000 manufacturing jobs were probably added last month. This is an excellent number compared with the last decade, but before 1999 it would have suggested an increase of 87,000 manufacturing jobs. (Note: using a different analysis, Calculated Risk estimates ~+60,000 manufacturing jobs were added in February. Great minds think alike, etc.)

(As a side note, using the ISM manufacturing employment sub-index yields the same result).

I'm not sure what the underlying fundamental reason for the change is. There certainly were both offshoring and efficiencies taking place before 1999. China did not accede to the WTO until 2001, so that is an incomplete explanation at best. It is also possible, given the last few months' strong manufacturing employment data, that the decade long aberration is abating. Finally, relative strength in manufacturing jobs, even though substantial, is still only a minority part of the overall jobs picture. I'll deal with construction, government, and non-government services separately. In that regard, the ISM non manufacturing index will be released tomorrow.

Monday, June 1, 2009

ISM Up

From the Institute for Supply Management:

The devil here is in the details. Consider the following information:

The overall PMI has increased 5 months in a row from 32.9 in January to 42.8 in May. while this is still technically in contraction because it's below 50 the overall trend is very positive.

New orders have increased from 33.1 in February to 55.1 in May. New orders have increased every month.

Production has increased from 36.2 in February to 46 in May. Production has increased every month.

The Backlog of orders has increased from 31 in February to 48 in May.

New export orders have increased from 37.5 February to 48 in May.

Here's a chart of the ISM from econoday:


There are still problem spots in the report. There were only 5 industries reporting growth:

Five of the 18 manufacturing industries reported growth in May. These industries — listed in order — are: Nonmetallic Mineral Products; Plastics & Rubber Products; Machinery; Food, Beverage & Tobacco Products; and Printing & Related Support Activities. The industries reporting contraction in May — listed in order — are: Textile Mills; Furniture & Related Products; Electrical Equipment, Appliances & Components; Fabricated Metal Products; Primary Metals; Transportation Equipment; Computer & Electronic Products; Wood Products; Apparel, Leather & Allied Products; Miscellaneous Manufacturing; Chemical Products; Petroleum & Coal Products; and Paper Products.


Employment, inventories and customer inventories are still weak.

But overall, the chart is encouraging.

Friday, May 1, 2009

ISM Increases Bit

From the Institute for Supply Management:

The report was issued today by Norbert J. Ore, CPSM, C.P.M., chair of the Institute for Supply Management™ Manufacturing Business Survey Committee. "The decline in the manufacturing sector continues to moderate. After six consecutive months below the 40-percent mark, the PMI, driven by the New Orders Index at 47.2 percent, shows a significant improvement. While this is a big step forward, there is still a large gap that must be closed before manufacturing begins to grow once again. The Customers' Inventories Index indicates that channels are paring inventories to acceptable levels after reporting inventories as 'too high' for eight consecutive months. The prices manufacturers pay for their goods and services continue to decline; however, copper prices have bottomed and are now starting to rise. This is definitely a good start for the second quarter."


The real news here is the new orders index:

ISM's New Orders Index registered 47.2 percent in April, 6 percentage points higher than the 41.2 percent registered in March. This is the 17th consecutive month of contraction in the New Orders Index. A New Orders Index above 48.8 percent, over time, is generally consistent with an increase in the Census Bureau's series on manufacturing orders (in constant 2000 dollars).


This is consistent with the GDP/inventory situation -- the contraction in inventories will lead to an increase in orders which will lead to an uptick in manufacturing. However -- before we get too excited, let's take note of a few things:


Industrial production has dropped pretty hard and


Is currently dropping at a rate not seen since the early 1970s. In addition


Capacity Utilization is at the lowest level in almost 40 years.

In other words, once we are back in positive territory on the ISM we have a lot of capacity to use up before we are back on a solid path.

Tuesday, February 3, 2009

Manufacturing Still Contracting

From the ISM:

The report was issued today by Norbert J. Ore, C.P.M., chair of the Institute for Supply Management™ Manufacturing Business Survey Committee. "January marked 12 months of contraction in the manufacturing sector. However, the rate of decline as measured by the PMI was slower than experienced in December. The January New Orders Index is at 33.2 percent, up from the seasonally adjusted 23.1 percent recorded in December. While this is a significant month-over-month improvement, it is still a sign of continuing weakness in the sector. Comments from our respondents indicate that it will take a recovery in automobiles and housing for the manufacturing sector to once again prosper. On a positive note, the Prices Index continues to indicate significant deflation in the prices that manufacturers have to pay for their inputs, and this should ultimately be good for the consumer."


There are several key points in the preceding paragraph:

1.) The index has shown a decline for 12 months. This is not a temporary slowdown caused by a market hiccup; it is a serious downward move that shows a fundamental weakness in the economy.

2.) Housing and autos must recover in order for manufacturing to recover. I've been harping on housing for, well, forever. The bottom line is so long as we are seeing home prices drop at fast year over year levels we aren't anywhere near a bottom in housing. And considering this chart:


Click for a larger image

We're nowhere near a bottom. When we see the y/o/y price declines slow -- that is, we see the y/o/y declines in the 3% - 5% range then we'll know that a bottom is approaching. But we're not there yet.

As for autos, consider the following chart from the BEA:


This chart shows the percentage change in real consumer spending on durable goods for the last 8 quarters. It has consistently moved lower. That means people are really pulling back on spending in a big way. Add to that an increasing savings rate and you have real problems for the US auto sector.

Thursday, December 18, 2008

Manufacturing Tanking Hard

We've had all the monthly manufacturing data released. The news is terrible.

Let's start with the ISM manufacturing survey. Here is the relevant graph:


Click for a larger image

Notice the index as dropped off a cliff over the last two months. Consider the following from the report:

PERFORMANCE BY INDUSTRY

The two industries reporting growth in November — listed in order — are: Apparel, Leather & Allied Products; and Paper Products. The industries reporting contraction in November are: Nonmetallic Mineral Products; Fabricated Metal Products; Textile Mills; Printing & Related Support Activities; Machinery; Electrical Equipment, Appliances & Components; Primary Metals; Transportation Equipment; Furniture & Related Products; Plastics & Rubber Products; Computer & Electronic Products; Chemical Products; Petroleum & Coal Products; Miscellaneous Manufacturing; Food, Beverage & Tobacco Products; and Wood Products.

WHAT RESPONDENTS ARE SAYING ...

* "The only positive thing of late is that the U.S. dollar has strengthened significantly against other currencies. We import the majority of our materials so this will have the effect of lowering our COGS." (Transportation Equipment)
* "Steel industry is our main customer, and they have had a real slowdown." (Computer & Electronic Products)
* "Criteria for projects is significantly higher with very short ROI periods." (Food, Beverage & Tobacco Products)
* "We have revised downward our top-line sales estimates for CY2009 by 8 percent due to the continued softness we see in the housing sector." (Machinery)
* "Suppliers are trying to hold onto pricing, but petrochemical and commodity prices are dropping like a rock." (Plastics & Rubber Products)


And consider the historic nature of the problem:

The contraction underway in the manufacturing sector is of historic proportions, the results of November's ISM manufacturing report that shows a headline index of 36.2, down nearly 3 points in the month. The reading is the lowest since 1980 recession. Key components in the survey show greater weakness than the headline index including a 31.5 level for the production index that matches the record low in May 1980. New orders at 27.9 is at its lowest since the early 80s while, in perhaps the most stunning reading of all, prices paid is at 25.5, down 11.5 points in the month for the lowest reading since early data in 1949 -- a critical indication that demand is falling and falling very sharply.


Notice that only two industries expanded whereas 16 contracted. Sales reports are being downgraded and the criteria for projects is increasing. Simply put -- things are bad. Also note we are at lows not seen since the 1980s. That is not a comparison anyone wants to make.

Overall industrial production is also down. From the Federal Reserve:

Industrial production decreased 0.6 percent in November with declines widespread across industries. The drop in output in September was revised down, and the rebound in October was revised up, in large part because both the decrease due to the September hurricanes and the subsequent partial recovery in October were larger than previously reported.

Manufacturing production dropped 1.4 percent in November despite the resumption of activity in the commercial aircraft industry after the resolution of a strike early in the month. The output of mines advanced 2.5 percent, primarily as a result of a further post-hurricane recovery in crude oil and natural gas operations in the Gulf of Mexico. Taken together, the rebounds after the strike and the hurricanes added almost 1 percentage point to the change in industrial production. The output of utilities rose 1.6 percent.

At 106.1 percent of its 2002 average, total industrial production in November was 5.5 percent below its level of a year earlier. The capacity utilization rate for total industry fell to 75.4 percent, a level 5.6 percentage points below its average level from 1972 to 2007.


Here are the relevant graphs:


Click for larger images

The year over year number is a big concern. Also note that capacity utilization is leveling at a lower level than the level we've had for the last few years. The bottom line is we're slowing down.

The New York area's manufacturing index is also in very bad shape:

The Empire State Manufacturing Survey indicates that conditions for New York manufacturers deteriorated significantly in December. The general business conditions index, at -25.8, held near the record low set in November. The new orders and shipments indexes also remained near their recent record lows, and the unfilled orders index dropped to a new low. The indexes for prices paid and prices received fell below zero, and employment indexes remained deep in negative territory. Future indexes remained subdued, with the capital spending and technology spending indexes remaining well below zero.


The graph shows the severity of the slowdown:


Click for a larger image

Again -- this is a significant decline which happened quickly. In indicates the slowdown is extreme, sharp and very sudden.

Finally there is the Philadelphia survey:

Conditions in the region's manufacturing sector continued to deteriorate this month, according to firms polled for the December Business Outlook Survey. All of the survey's broad indicators remained negative this month and at relatively low levels. Firms reported declines in input prices and the prices for their own manufactured goods this month. Consistent with the weakness in current activity, most of the survey's indicators of future activity slid further into negative territory, suggesting that the region's manufacturing executives expect continued declines over the next six months.


Here is the relevant graph:


There is no good news in any of these releases. Simply put, manufacturing is in terrible shape.

Tuesday, June 3, 2008

Construction Spending Drops; Manufacturing Weak

From the WSJ:

U.S. manufacturing activity contracted slightly in May, as exports kept the sector afloat and prices surged, but performed better than many economists had expected.

The Institute for Supply Management said its index of manufacturing activity rose to 49.6 in May from 48.6 in April. It was the fourth consecutive month that the index was below 50; readings below 50 signal a contraction in overall activity.

Even so, the report bolstered other recent data suggesting the economy is stagnant but not collapsing.

A separate report showed construction spending in April dropped by a seasonally adjusted 0.4% from the previous month, to $1.12 billion. Spending on private nonresidential construction, which includes hotels and office buildings, rose 1.6%, partly offsetting the slump in residential construction, which declined 2.3% in April and is down 21% from a year earlier, the Commerce Department said.

In the ISM report, exports continued to increase, extending a five-and-a-half-year trend that is helping offset slowing U.S. demand, and production expanded. New orders rose and imports grew slightly. But high commodity costs pushed prices to a four-year high, and employment and inventories contracted.

"Were it not for the weak dollar," which makes prices of U.S. goods cheaper abroad and stimulates export orders, "I really do believe we'd be looking at far lower readings," said Norbert Ore, a Georgia-Pacific Corp. executive who directs the survey. He noted that 80% of ISM member companies are exporters.


TO place this information in the largest context, go to this article which has a group of charts related to the manufacturing sector.

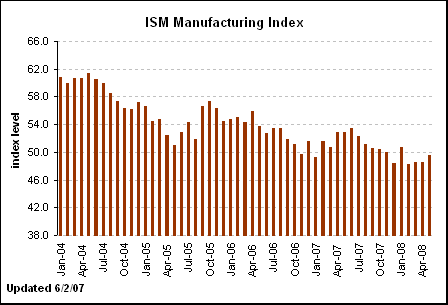
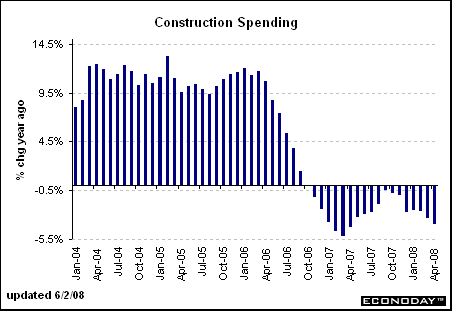
Let's look at the graphs/charts of these numbers to see what they say:


The general trend since January 2004 is lower. That's the macro-trend that supplies the backdrop. That means the one month increase will have to continue for a few more months before we can say the trend is reversed. Also note this number has been below 50 for four months. That in an of itself is a trend (a negative one) to keep in mind.


As for construction, it has had a negative impact on the economy for the better part of two years now. Notice that the latest numbers -- which show a year over year decline -- are being compared to periods where the number was already negative. That's not good news in the long run.

The fact that most ISM companies are exporters is very eye-opening. It does imply the number is skewed towards positive numbers in the current environment.

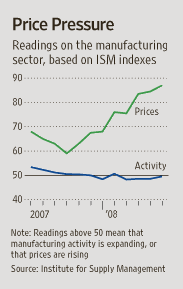
Finally -- notice this chart from the WSJ article:


This is the prices part of the ISM report, which has been increasing for some time. That's not good. As the article noted:

Respondents to the ISM survey noted prices are "skyrocketing" and posing "major hurdles." The prices component of the ISM survey jumped to 87 in May from 84.5 in April, and Mr. Ore noted that doesn't yet capture the full impact of rising oil prices.


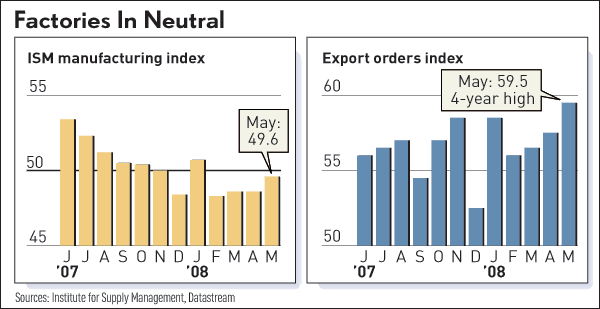
This chart from the IBD story shows two things. First, it gives us a better read of how the current numbers compare. Secondly, it shows how exports are helping out right now.

Monday, December 3, 2007

Manufacturing Slowing

From CNBC:

Growth in U.S. factory activity slipped in November to the lowest since January as tight credit conditions and the housing downturn restrained production, according to an industry report released Monday.

The Institute for Supply Management said its index of national factory activity edged down for the fifth straight month, to 50.8 from 50.9 in October, above economists' median forecast for a slip to 50.5. A reading of 50 denotes growth.


Here is a link to the report.

Let's coordinate this data with other data points.


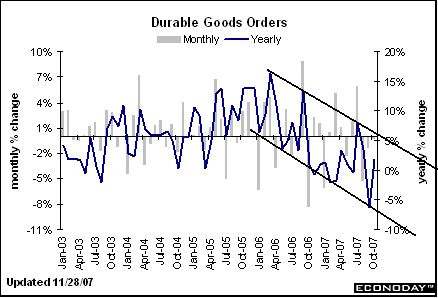
Durable Goods orders have been in a general decline for the last two years. But look closely at the blue line which is the year-over-year percent change. Notice it has been in negative territory for most of the time since late last year.


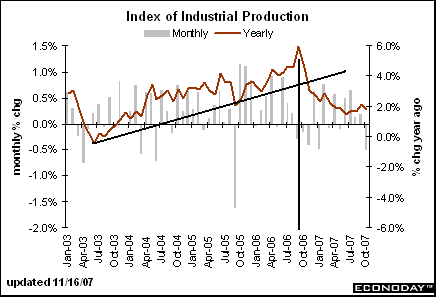
Industrial production has been declining since last last year. However, the overall growth is still positive. It's in a slower growth phase right now.


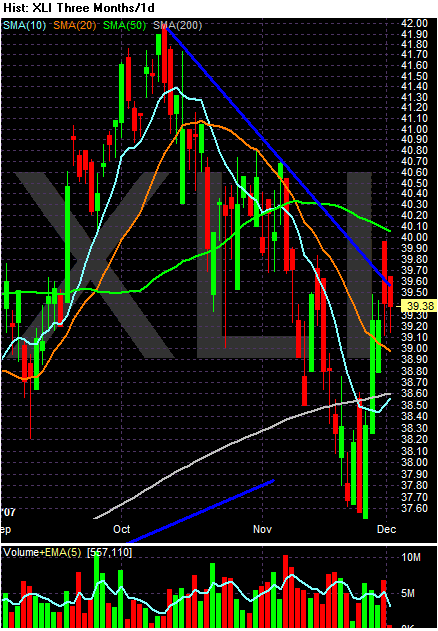
As a result of all this negatively in the, the industrial ETF has been declining since early October. While is is currently over the 200 day simple moving average(SMA), the shorter SMAs (the 10 and 20) are both headed lower. The 50 day SMA recently turned lower as well. The index has yet to convincingly break the upside resistance from the downtrend line started in early October. Traders are obviously concerned about this sector.

It's also interesting to note that while exports have been increasing strongly for most of this year, that boost has not saved this sector from the market downturn.

Monday, July 2, 2007

ISM Increases

From the Institute for Supply Management:

In June, manufacturing expanded at its fastest pace since April 2006 when the PMI Index registered 56.9. This performance appears sustainable in the third quarter due to the current strength in New Orders and Production."

WHAT RESPONDENTS ARE SAYING ...

* "Business remains brisk with isolated areas of softness." (Nonmetallic Mineral Products)
* "Things are picking up." (Primary Metals)
* "Busy now but still down approximately 13 percent from this time last year." (Fabricated Metal Products)
* "Exchange rate and some raw material increases have had a negative impact on our purchased components." (Transportation Equipment)
* "Petroleum-based material prices have begun to escalate at a faster pace." (Paper Products)


A few notes.

1.) This is a good report. There are a group of economists currently arguing that business spending and growth will keep the economy from falling into a recession. This helps to bolster that argument.

2.) "Busy now but still down approximately 13 percent from this time last year." This comment jibes with the following information from Barron's pulse of the economy section. This indicates things are improving, but are still in general below year ago levels.

3.) Commodities and Industrials have been strong performers for the last half year. Some of these industries have sold off over the recent pullback. However, this news might make those areas more attractive again.

Tuesday, May 1, 2007

ISM Increases

From the Institute for Supply Management:

Manufacturing growth accelerated in April as the PMI registered 54.7 percent, an increase of 3.8 percentage points when compared to March's reading of 50.9 percent. A reading above 50 percent indicates that the manufacturing economy is generally expanding; below 50 percent indicates that it is generally contracting.

.....

ISM's New Orders Index surged to 58.5 percent in April.

.....

ISM's Production Index registered 57.3 percent in April, 4.3 percentage points higher than the 53 percent reported in March.

.....

In April, the ISM Prices Index registered 73 percent, indicating manufacturers are paying higher prices on average when compared to March.


In short, this is a solid report. It indicates manufacturing may be poised for a rebound. If we have 2-3 more months of similar performance in the index then manufacturing could be said to be turning around.

The only drawback is the prices paid component of the index. Inflation has been incredibly sticky this expansion. Despite the clear economic slowdown for the last three quarters inflation has been very stubbornly clinging to the 2%-3% range. This report confirms that trend is likely to continue for the foreseeable future.

Monday, February 5, 2007

Manufacturing, ISM and GDP

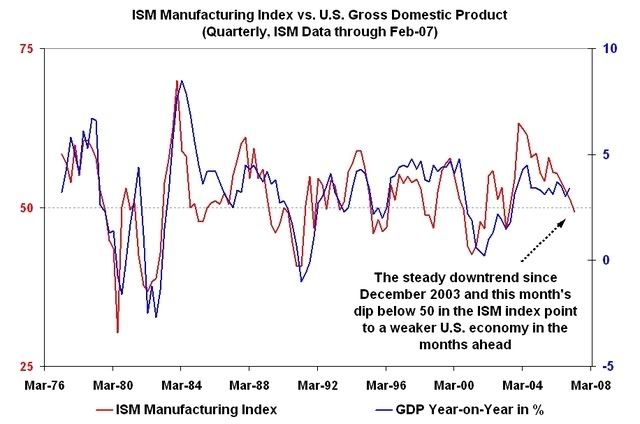
The following chart is from the Big Picture Blog:

Photobucket - Video and Image Hosting

The last rounds of Federal Reserve District manufacturing reports and Chicago ISM index were weak. They all pointed to a slowing in the manufacturing sector. This chart shows the trend has been in place for some time. As we enter February and a new round a Fed manufacturing district reports, it's important to pay attention to all of the reports various details.